How to Build a Fintech Dashboard in Next.js, Step by Step
Build a fintech or personal finance dashboard in Next.js with English and Arabic, charts and cards, and learn which parts you connect to your own API.
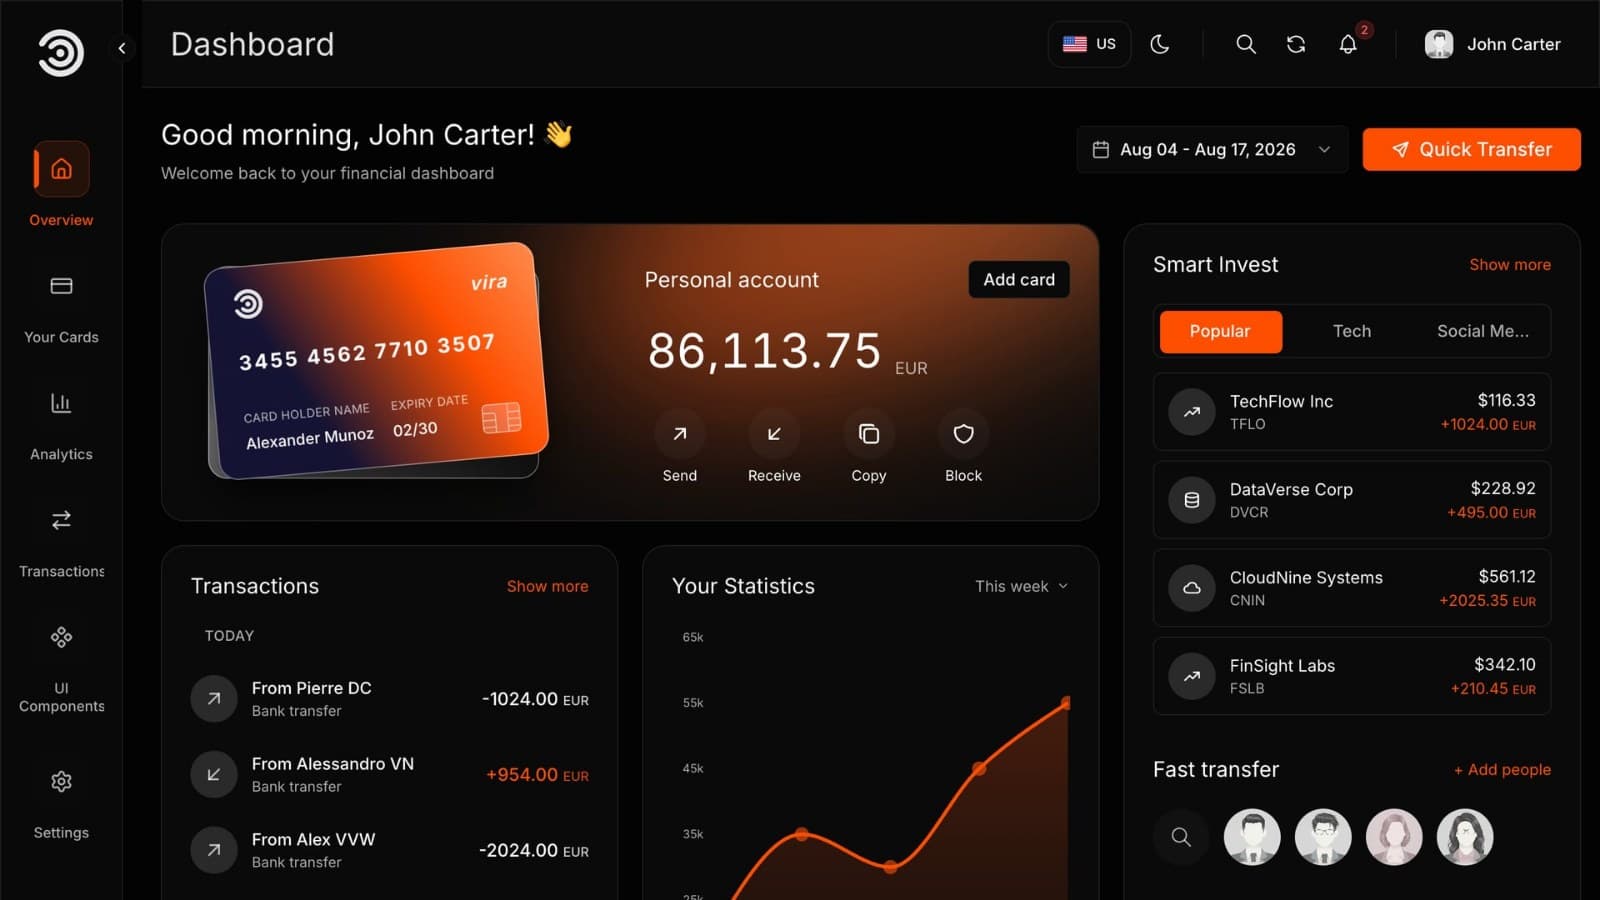
This guide shows how to build a fintech or personal finance dashboard in Next.js, in English and Arabic, from the Aniq UI Financial Dashboard template. You will run it, brand it, swap in your own data and put it online, with a clear picture of which parts you connect yourself.
That last point matters, so here it is up front: the template is a front end. It has no database, no back end and no real sign-in. Every balance, card and transaction on screen is sample data written in the code. What you get is a finished, working interface that is ready for your API. The steps below show where that API plugs in, and what to check at each stage.
Before you start: decisions to make
A finance interface is easy to start and hard to finish if the big questions stay open. Answer these first, on paper.
- Where does the data come from? The template contains none. You need an API of your own, or a service you already use, that returns balances, cards and transactions. Decide who builds it and when, because the screens will wait on it.
- How do people sign in? The sign-in that ships is a stand-in running inside the browser. Pick the real method (your own accounts, an identity provider or something else) and who owns the session on the server.
- Which actions must really work on day one? Searching and exporting transactions already work in the browser. Adding a transaction, adding a card and sending a transfer do not save anywhere yet. List the ones you will keep and the ones you will hide.
- Which languages and which direction? English and Arabic ship, and the Arabic pages run right to left. A third language is possible but needs a few edits, so decide early.
- What are the rules for money data? Handling balances and card details can come with legal, security and partner requirements that depend on where you operate. This template does not decide those for you. Talk to your payment or banking partner and, where it applies, your regulator, before real data reaches the screens.
- Where will it be hosted? Vercel, a Node.js server or a Docker host all work. Pick one before you buy a domain.
The brief
Kestrel Budget is a budgeting app for freelancers whose income arrives in lumps. Customers read in English or Arabic. The team asks for this:
- One screen that shows the balance, the payment cards and the latest transactions the moment someone signs in.
- A transactions page where a freelancer can search, filter by date and export a file for their accountant.
- Charts that compare income against expenses and break spending into categories, since freelance months vary a lot.
- A cards page where a customer can lock a card and see its details.
- English and Arabic, with the Arabic version laid out right to left.
- The company's name, logo and brand colour, in light and dark mode.
- A real sign-in and real data from Kestrel's own API before any customer sees it.
How the template covers the brief
| Need | Where it lives | What you use |
|---|---|---|
| Balance, cards, latest activity | Website (the Next.js app) | Overview page at /en/dashboard |
| Search, filter, export | Website | Transactions page with date range, Filter dialog and CSV export |
| Income vs expenses, categories | Website | Analytics page with Recharts charts you can download as PNG |
| Card controls | Website; saving needs your API | Your Cards page with lock, delete and show number |
| English and Arabic | Website | /en and /ar addresses, files under messages/ |
| Brand and themes | Website | Message files, logo.svg, DEFAULT_THEME_COLOR |
| Real data and real sign-in | Your own API (not included) | Sample data files beside each widget; the sign-in code you replace |
Template, from scratch or a hosted builder
Three routes lead to a finance dashboard, and the right one depends on your team.
From scratch. You control every detail, but you also design and build the layout, the charts, the tables, the drag-and-drop cards, the dark and light themes and the right-to-left version before you reach the part that is special to your product. That is a reasonable choice if the interface itself is your competitive edge.
A hosted dashboard or BI builder. These tools can connect to data sources and draw charts quickly, and you do not manage hosting. The trade-off is that the result looks like the tool rather than like your product, customers usually see its limits on branding and layout, and an Arabic right-to-left customer experience may or may not be supported. Check its pricing, its embedding options and its export story before you rely on it.
A template with source code. You get the finished interface, own the code and host it where you like. The cost is the work you saw in the decisions above: you supply the API, the sign-in and the compliance work. For a team with a back end or the budget to build one, that division of labor is efficient, because the part that remains is the part only you can do.
Kestrel has one developer and a plan for a small API, so it takes the template. A team with no developer should look at a hosted option instead.
An example launch plan by week
This schedule is an example for Kestrel, not a promise about how long your project takes.
- Week 1, run and review. Start the template, tour every page in both languages and both themes, and settle the decisions above.
- Week 2, brand and trim. Change the name, logo and colour, translate the new text, and hide the pages and buttons you will not build.
- Week 3, connect the first data. Replace the signed-in user and the transactions with real API calls. Leave the rest on sample data for now.
- Week 4, connect the rest and sign in properly. Cards, analytics figures and the real sign-in, with the session checked on the server.
- Week 5, test and ship. Production build, phone and desktop checks, launch checklist, deploy.
Step by step
1. Decide what you connect yourself
Before you open the code, write down the three things the template leaves to you: who is signed in, where the numbers come from, and what happens when a customer presses a button that changes something. For Kestrel, that is a sign-in service, an API that returns balances, cards and transactions, and endpoints for the actions (adding a transaction, saving settings).
The template gives you the screens, the charts, the forms and their checks. You give it the data. This split is useful, because you can build the API at your own pace while the interface already looks finished.
Check: you have a short written list titled "what I connect", with an owner and a rough order. What usually goes wrong: teams assume the sign-in screen is a working login and discover the gap late.
2. Run it on your computer
Install Docker Desktop, then work through these sub-steps.
2a. Download. In your Aniq UI account, open My templates and download the ZIP.
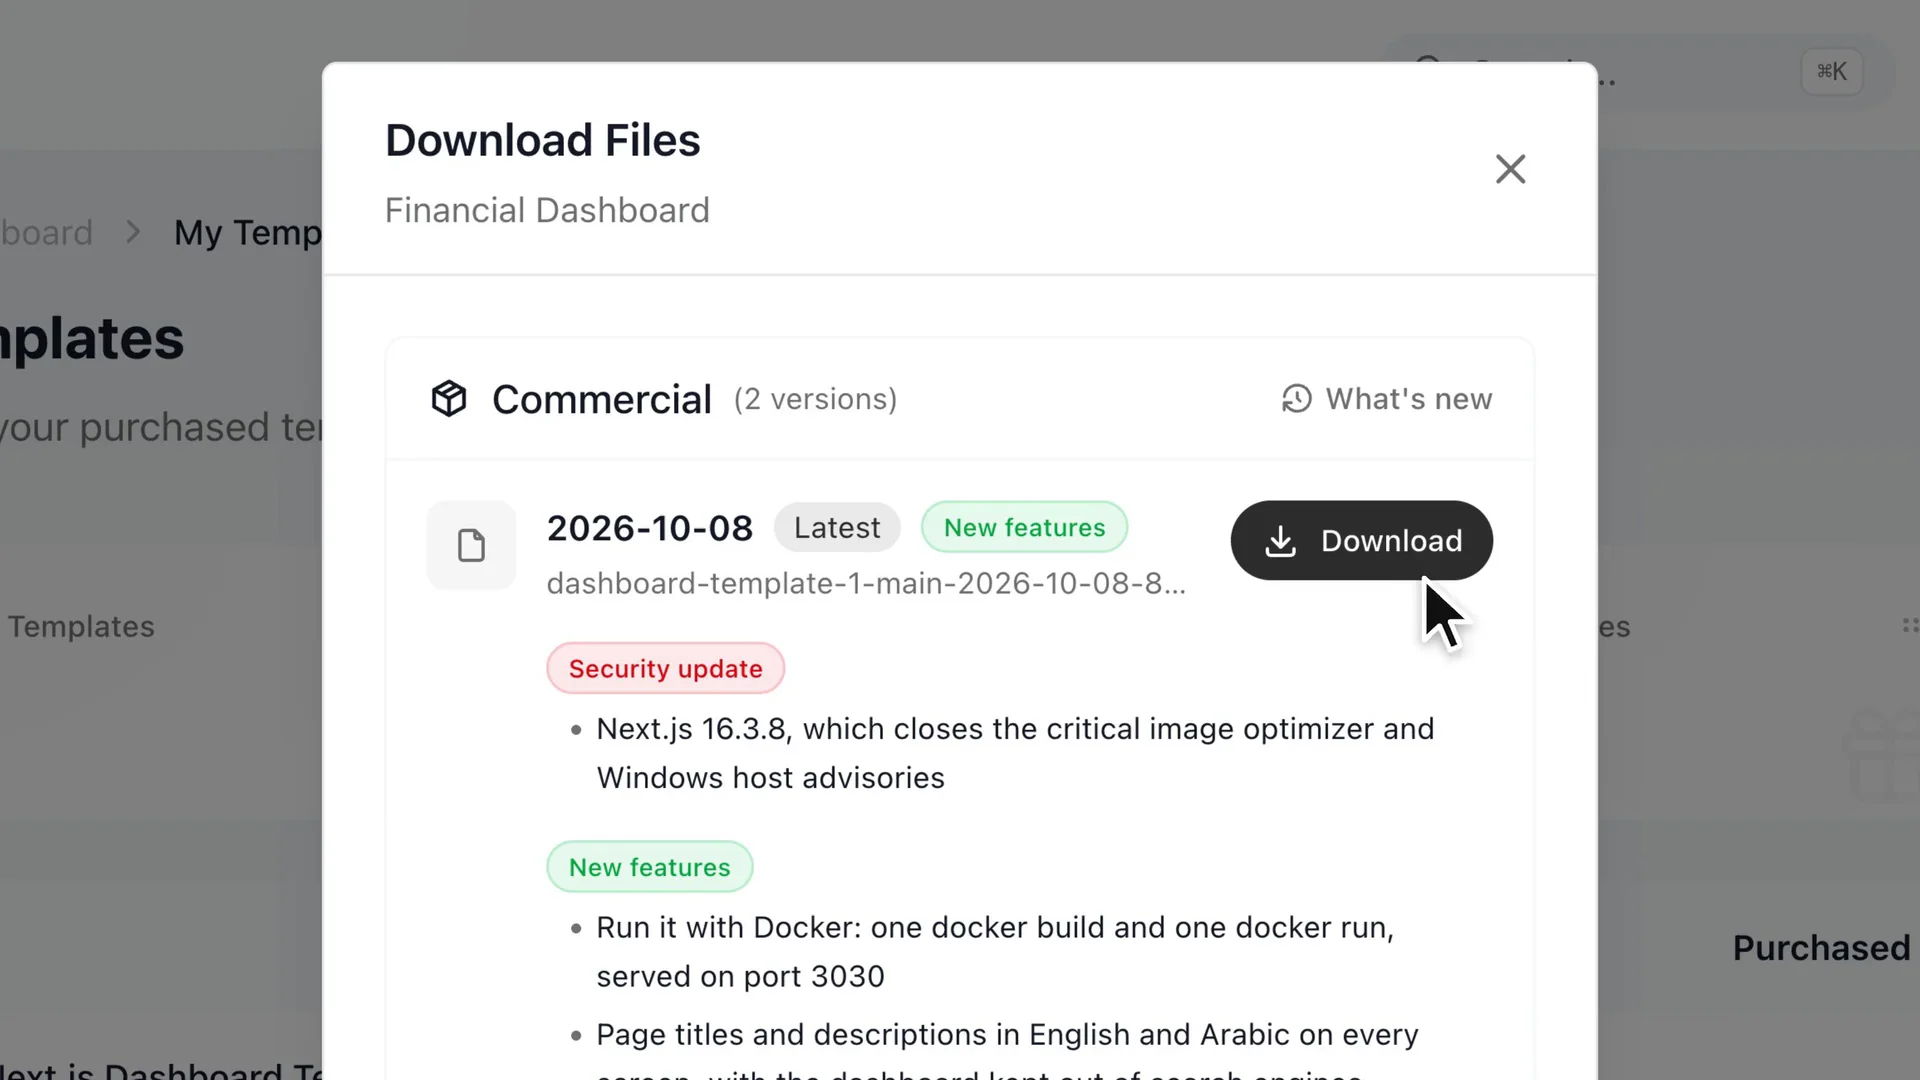
Look at where the download button sits on the My templates page.
2b. Unzip and open the folder. Unpack the archive and open a terminal in the dashboard-template-1 folder.
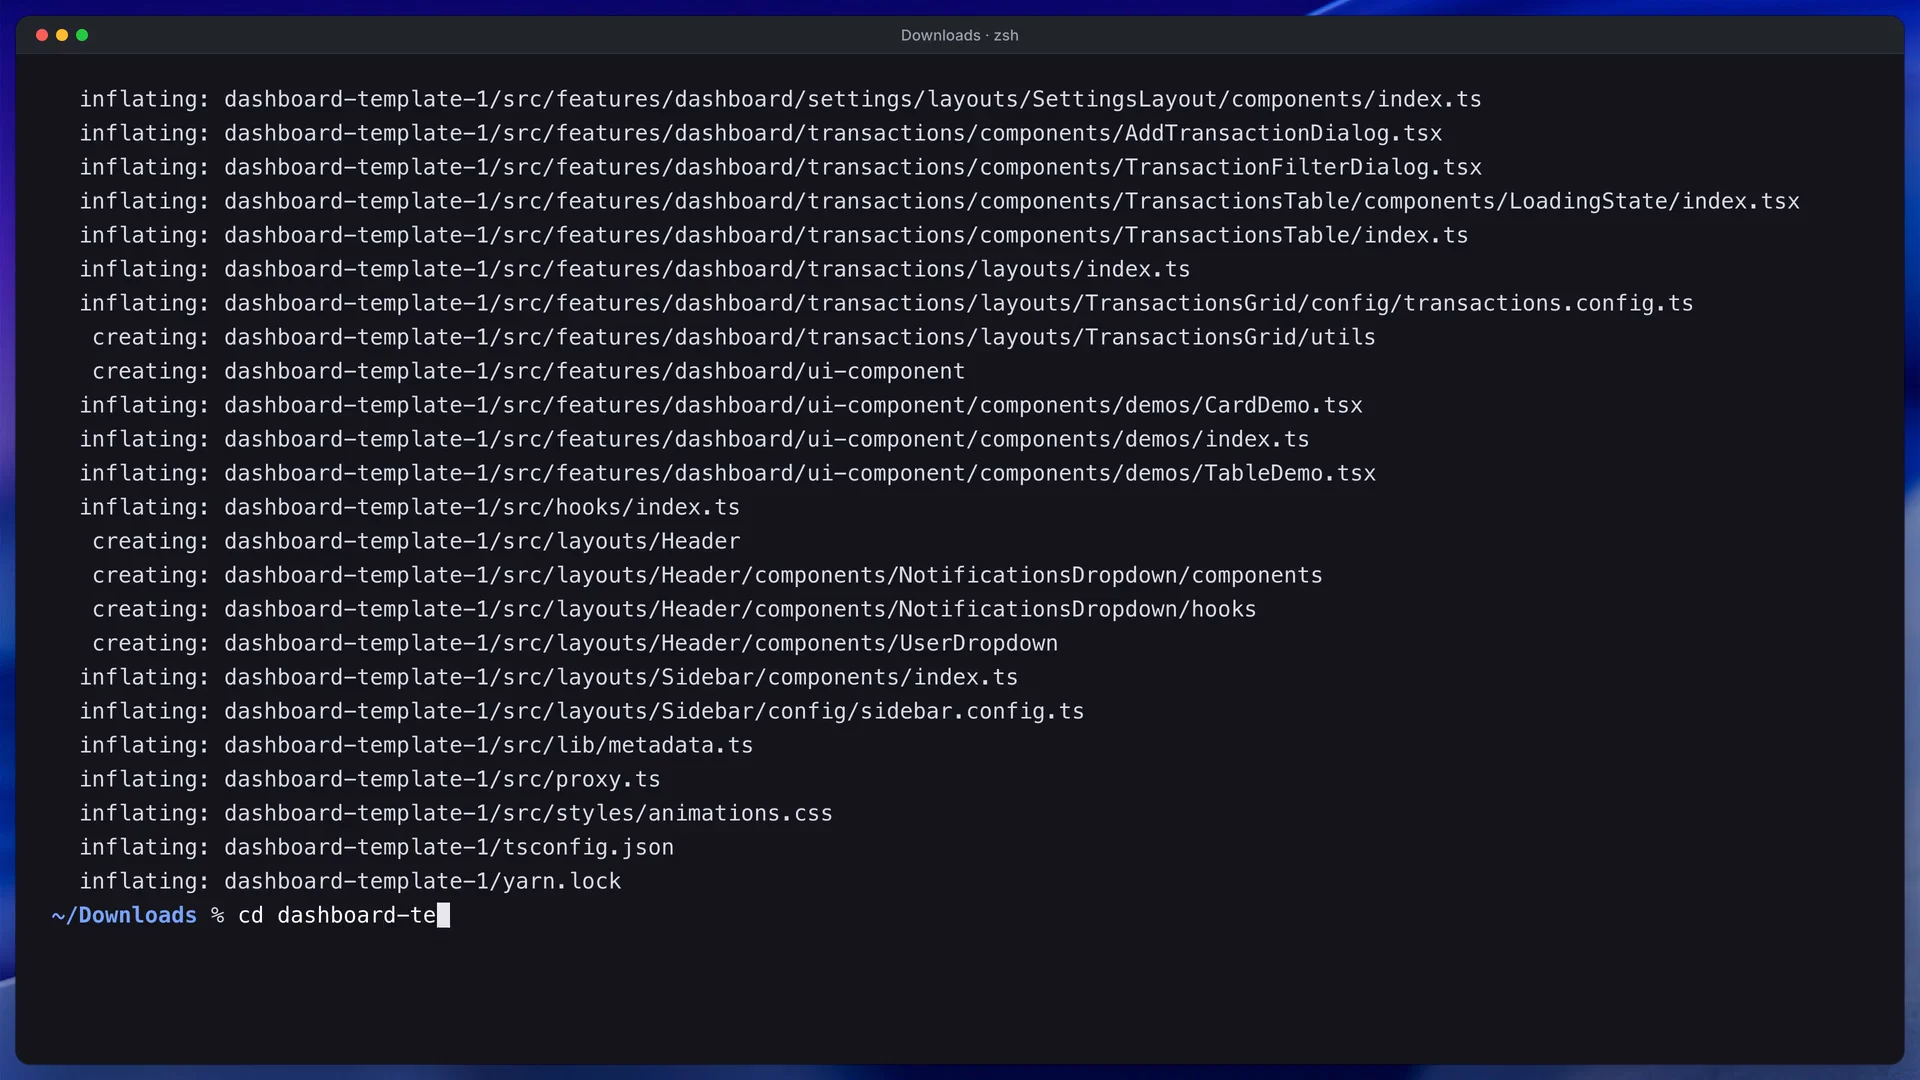
Look at the terminal path: every later command runs from this folder.
2c. Build the image, then start a container.
docker build -t financial-dashboard .
docker run -p 3030:3030 financial-dashboard
Expect the first build to take a few minutes, with internet access required, because the dependencies and the app build both happen inside the image.
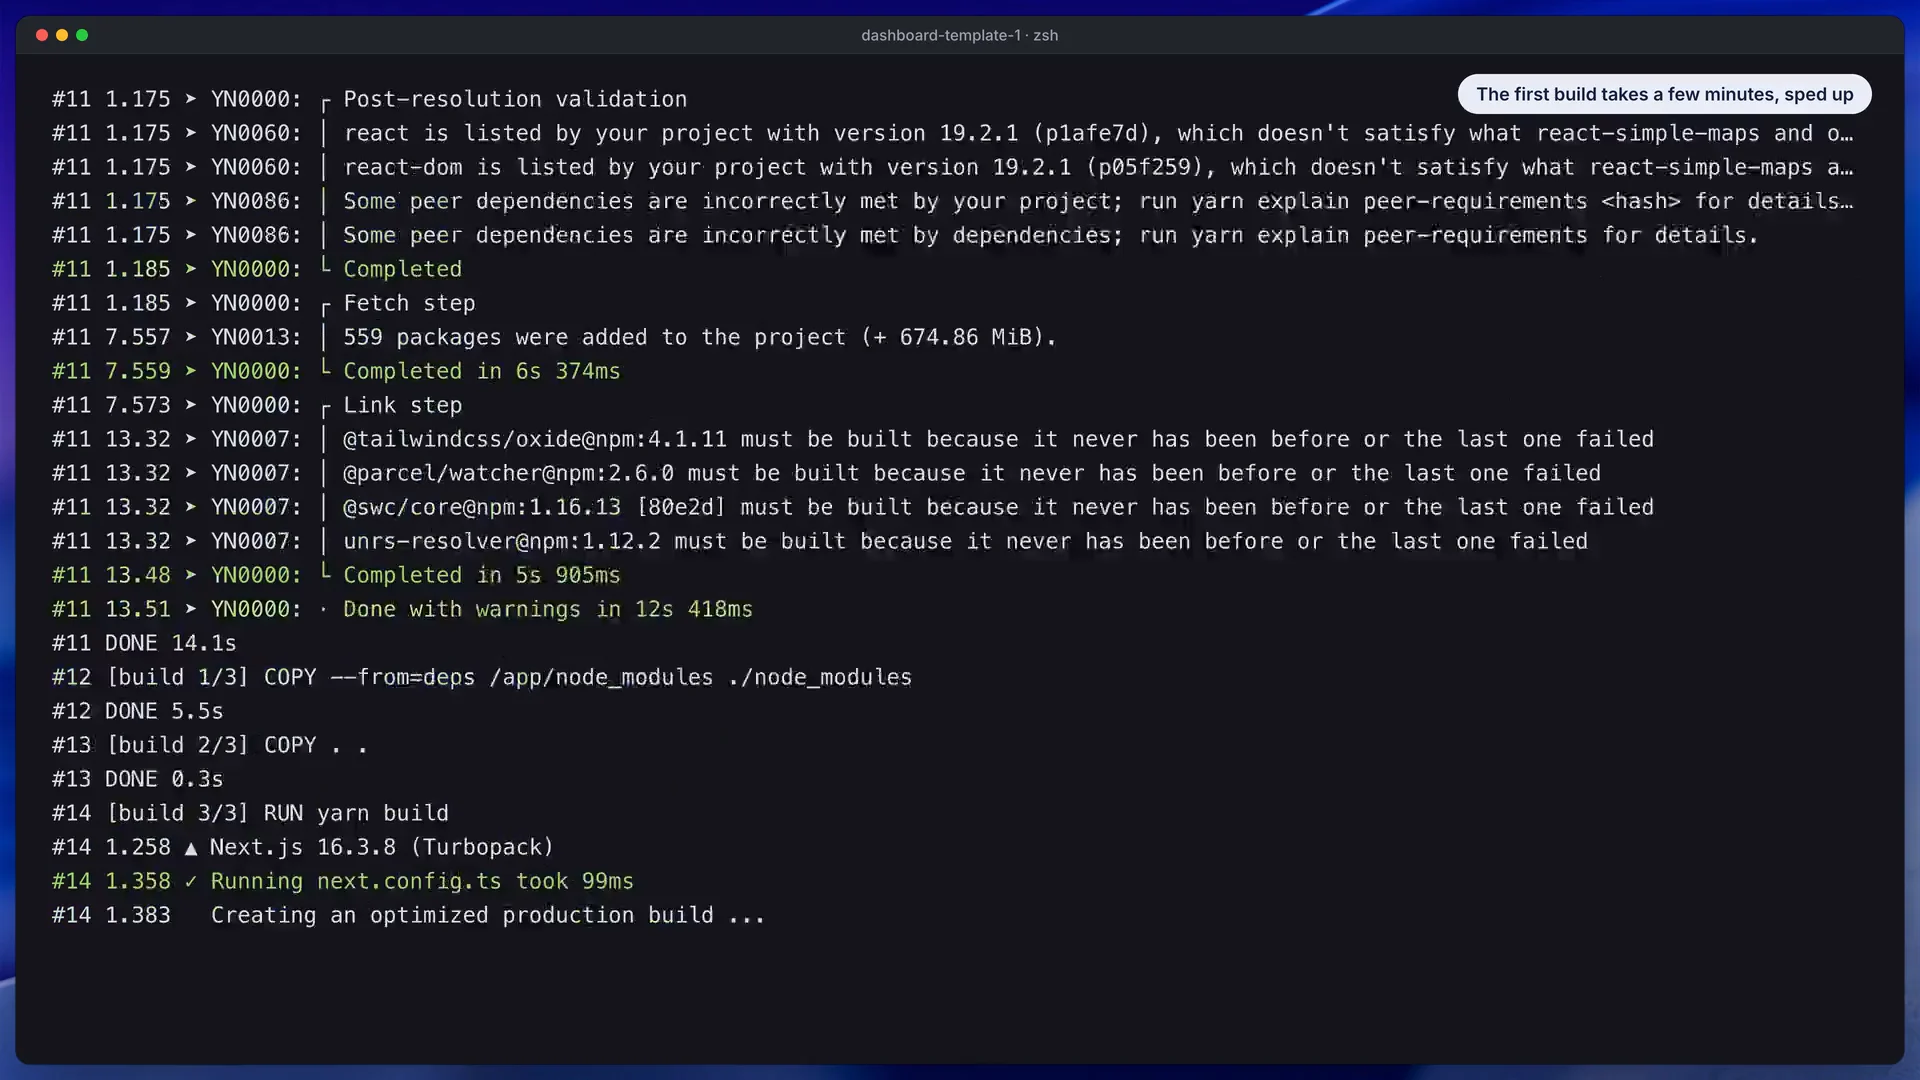
Look at the build log, which ends when the image is ready to run.
2d. Open it. Go to localhost:3030/en/login and sign in with admin@dashboard.com and the password Admin@123. If port 3030 is busy, swap the first number in the -p option and leave the second alone, for example docker run -p 3041:3030 financial-dashboard.
Prefer Node.js? Install version 20.9 or newer, run corepack enable once, then yarn install and yarn dev. The project pins Yarn 4, so use Yarn rather than npm.
What to check: the overview opens with a balance, a stack of cards and a transactions list. What usually goes wrong: Docker is not running (start Docker Desktop and wait for the engine), a port is already taken, or Yarn answers with version 1.22 because Corepack is not on. To stop the container, press Ctrl+C, or use docker stop with the ID from docker ps. Edits do not reach a built image, so rebuild it after changing a file.
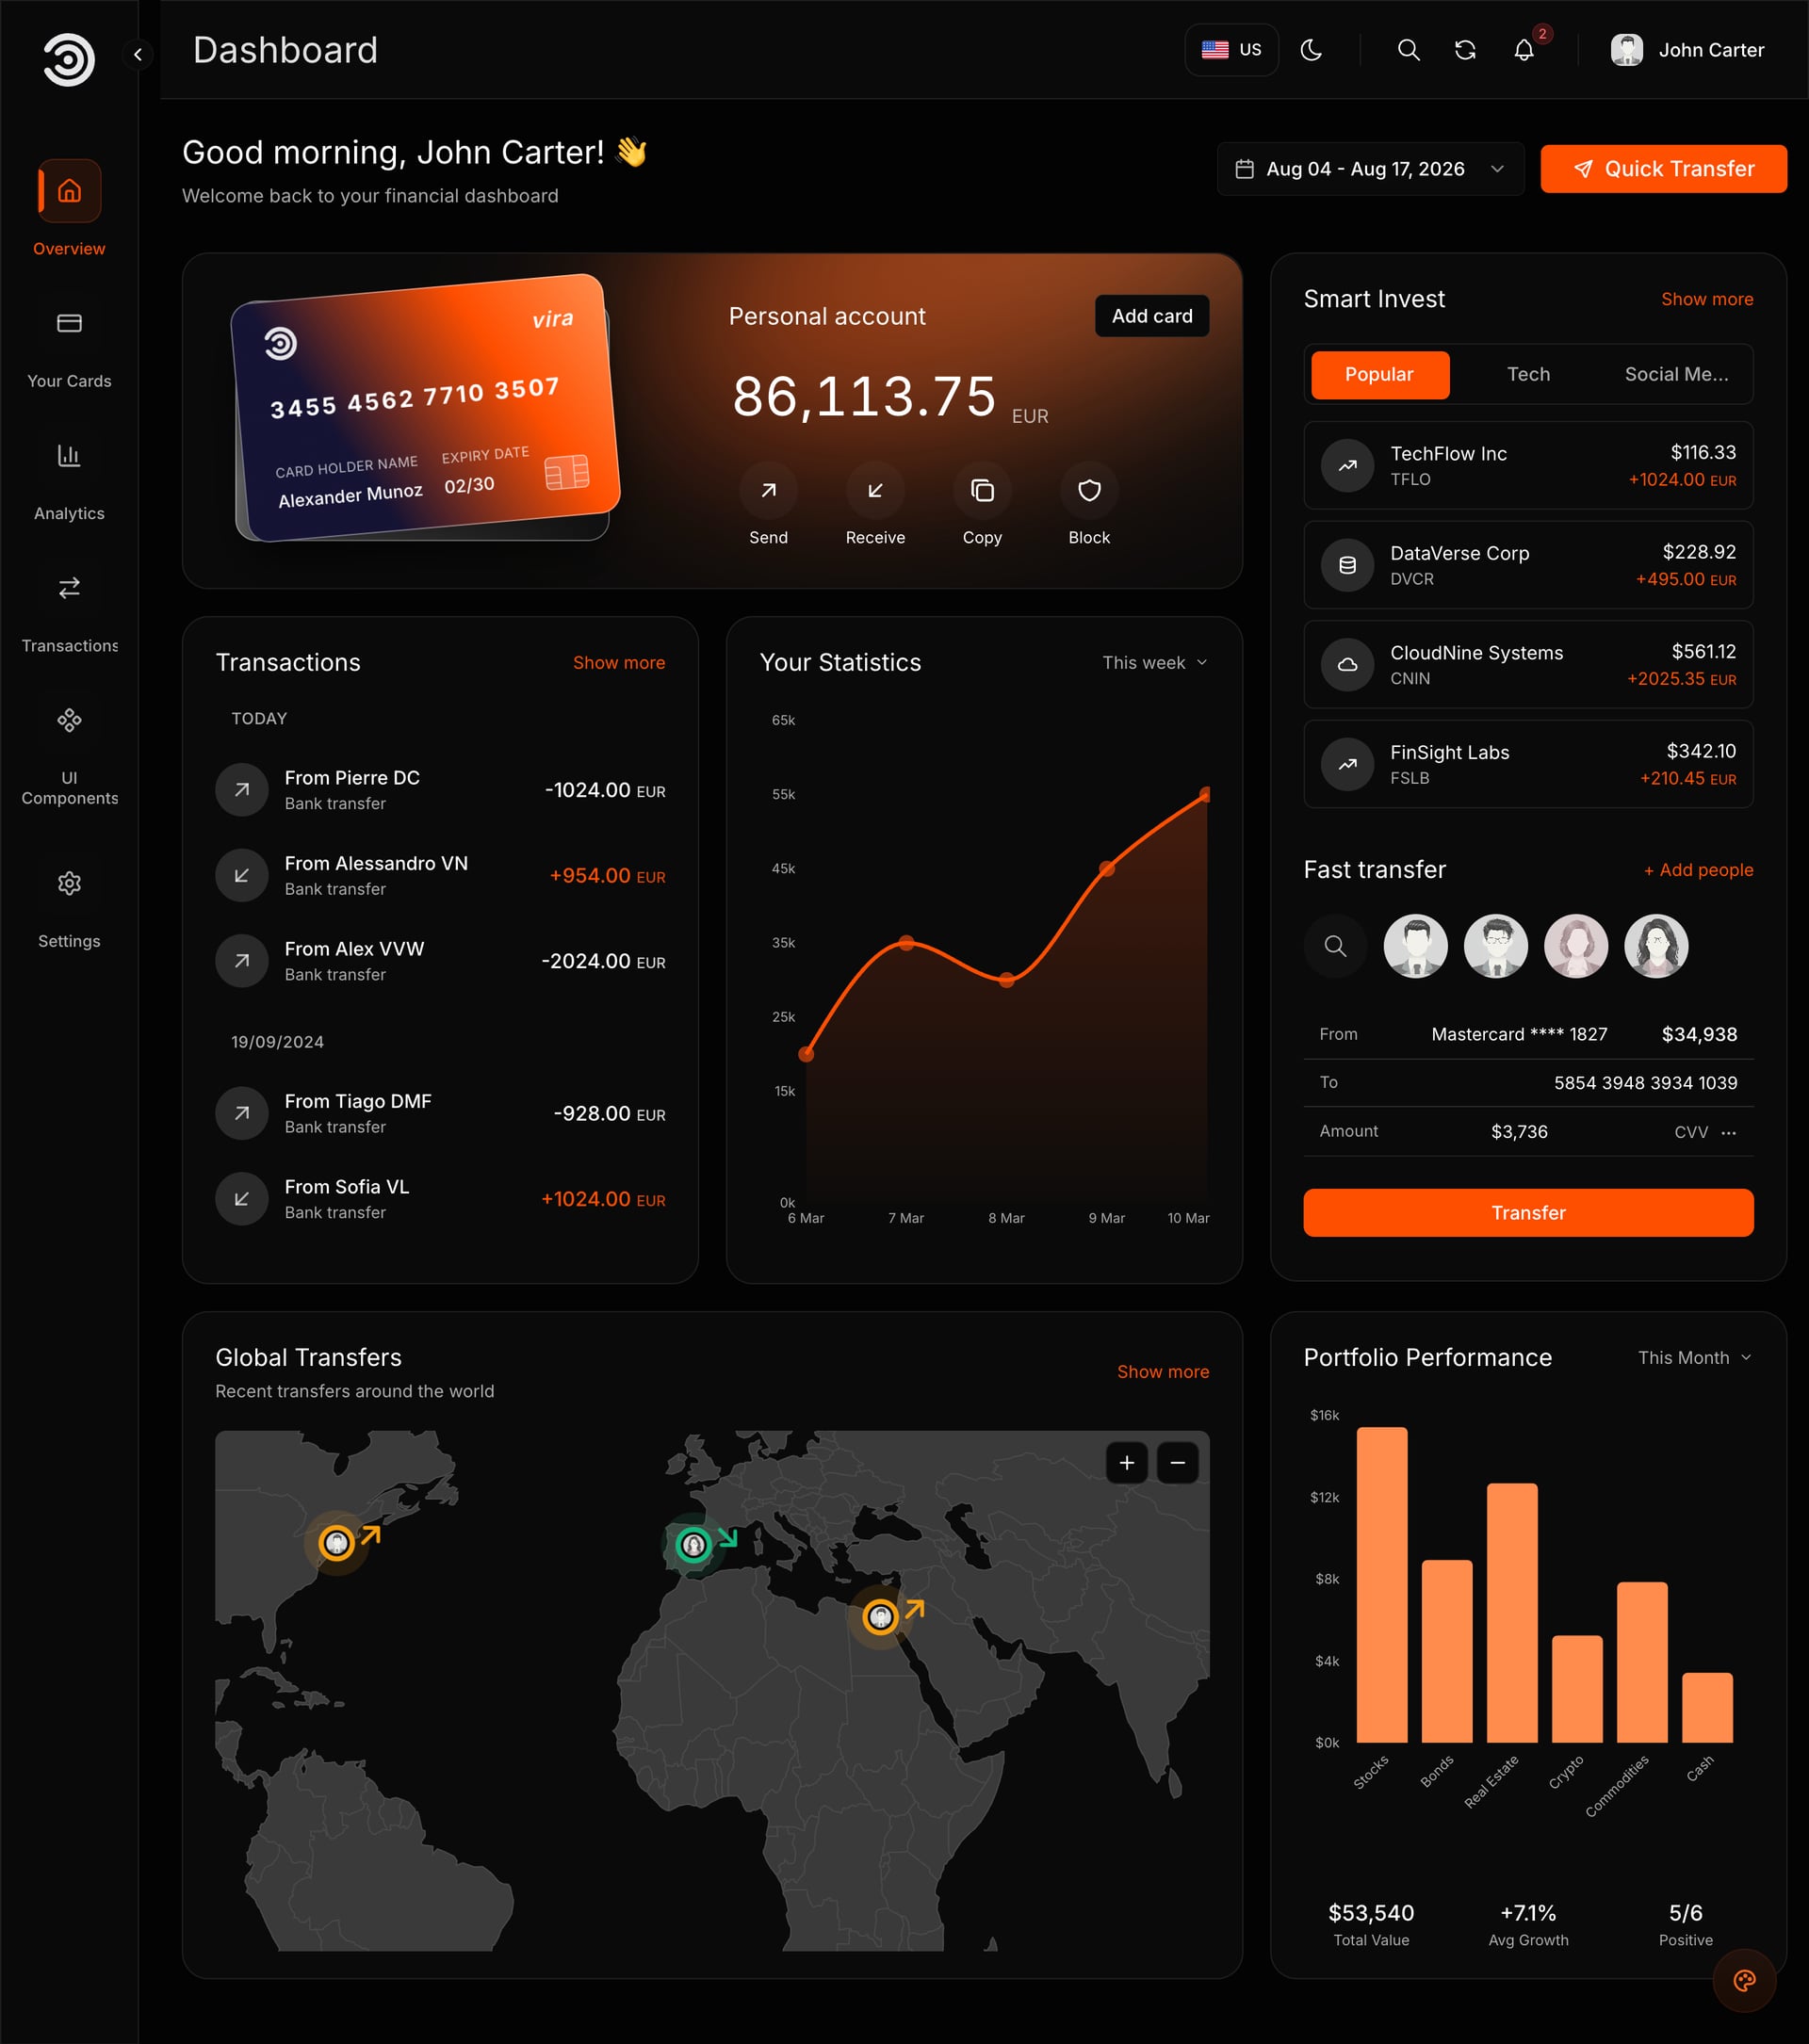
Look at how the page is laid out as a bento of widgets: cards, transactions, statistics, a map and a portfolio chart.
3. Walk through every page
The template ships these pages, each under /en and /ar:
- Overview: the landing screen after sign-in, with a quick transfer form, the balance above a stack of payment cards, a stock watchlist, the newest transactions, a statistics chart, a map of transfers and a portfolio chart.
- Analytics: four headline numbers, then charts for income versus costs, spending split by category and activity across the week, with a recent transactions table below.
- Transactions: the full history, with search, filters, sorting, paging and an export button.
- Your Cards: the card list with details for the selected card.
- Settings: profile, security, notifications and preferences.
- UI Components: every reusable part, rendered with live examples.
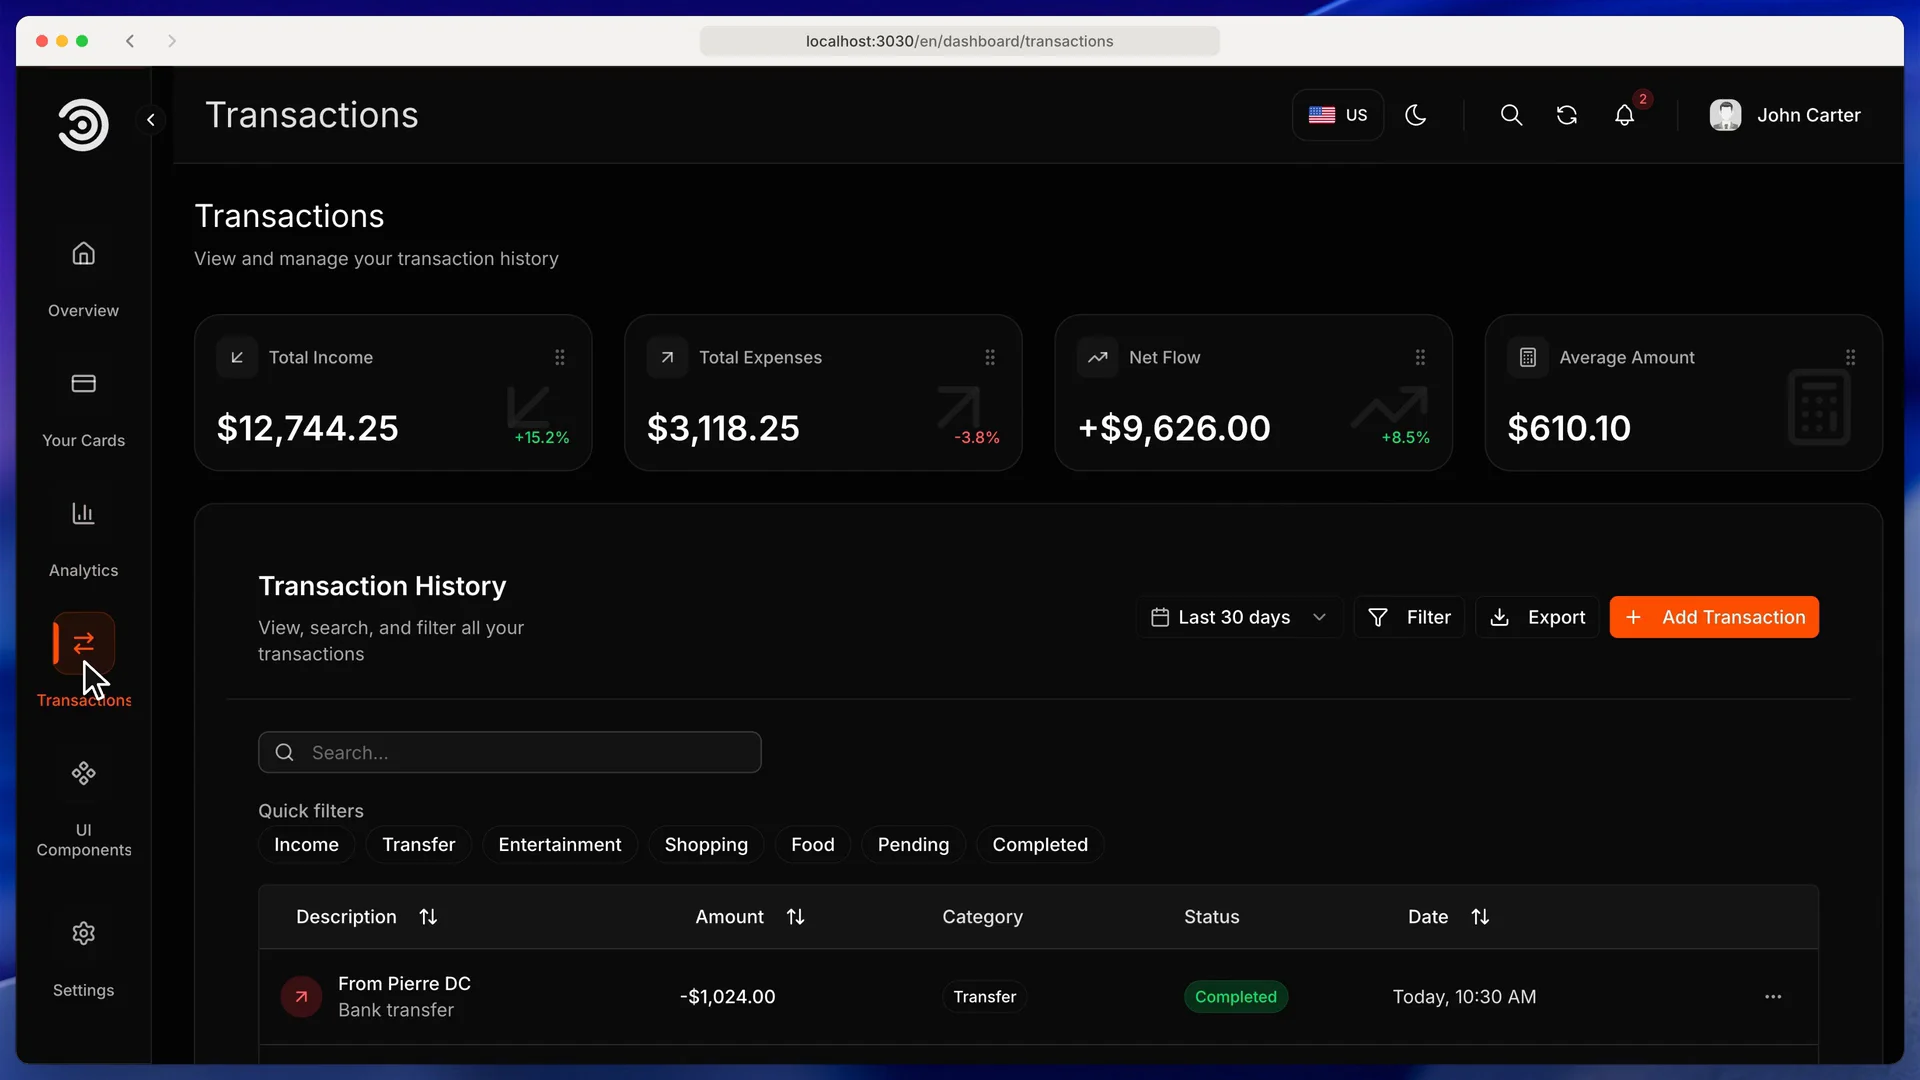
Look at the sidebar, which is the map of everything you will brand, translate and connect.
Decide which pages you keep. Kestrel keeps all of them, but a budgeting tool with no card product could drop the cards page and its sidebar link.
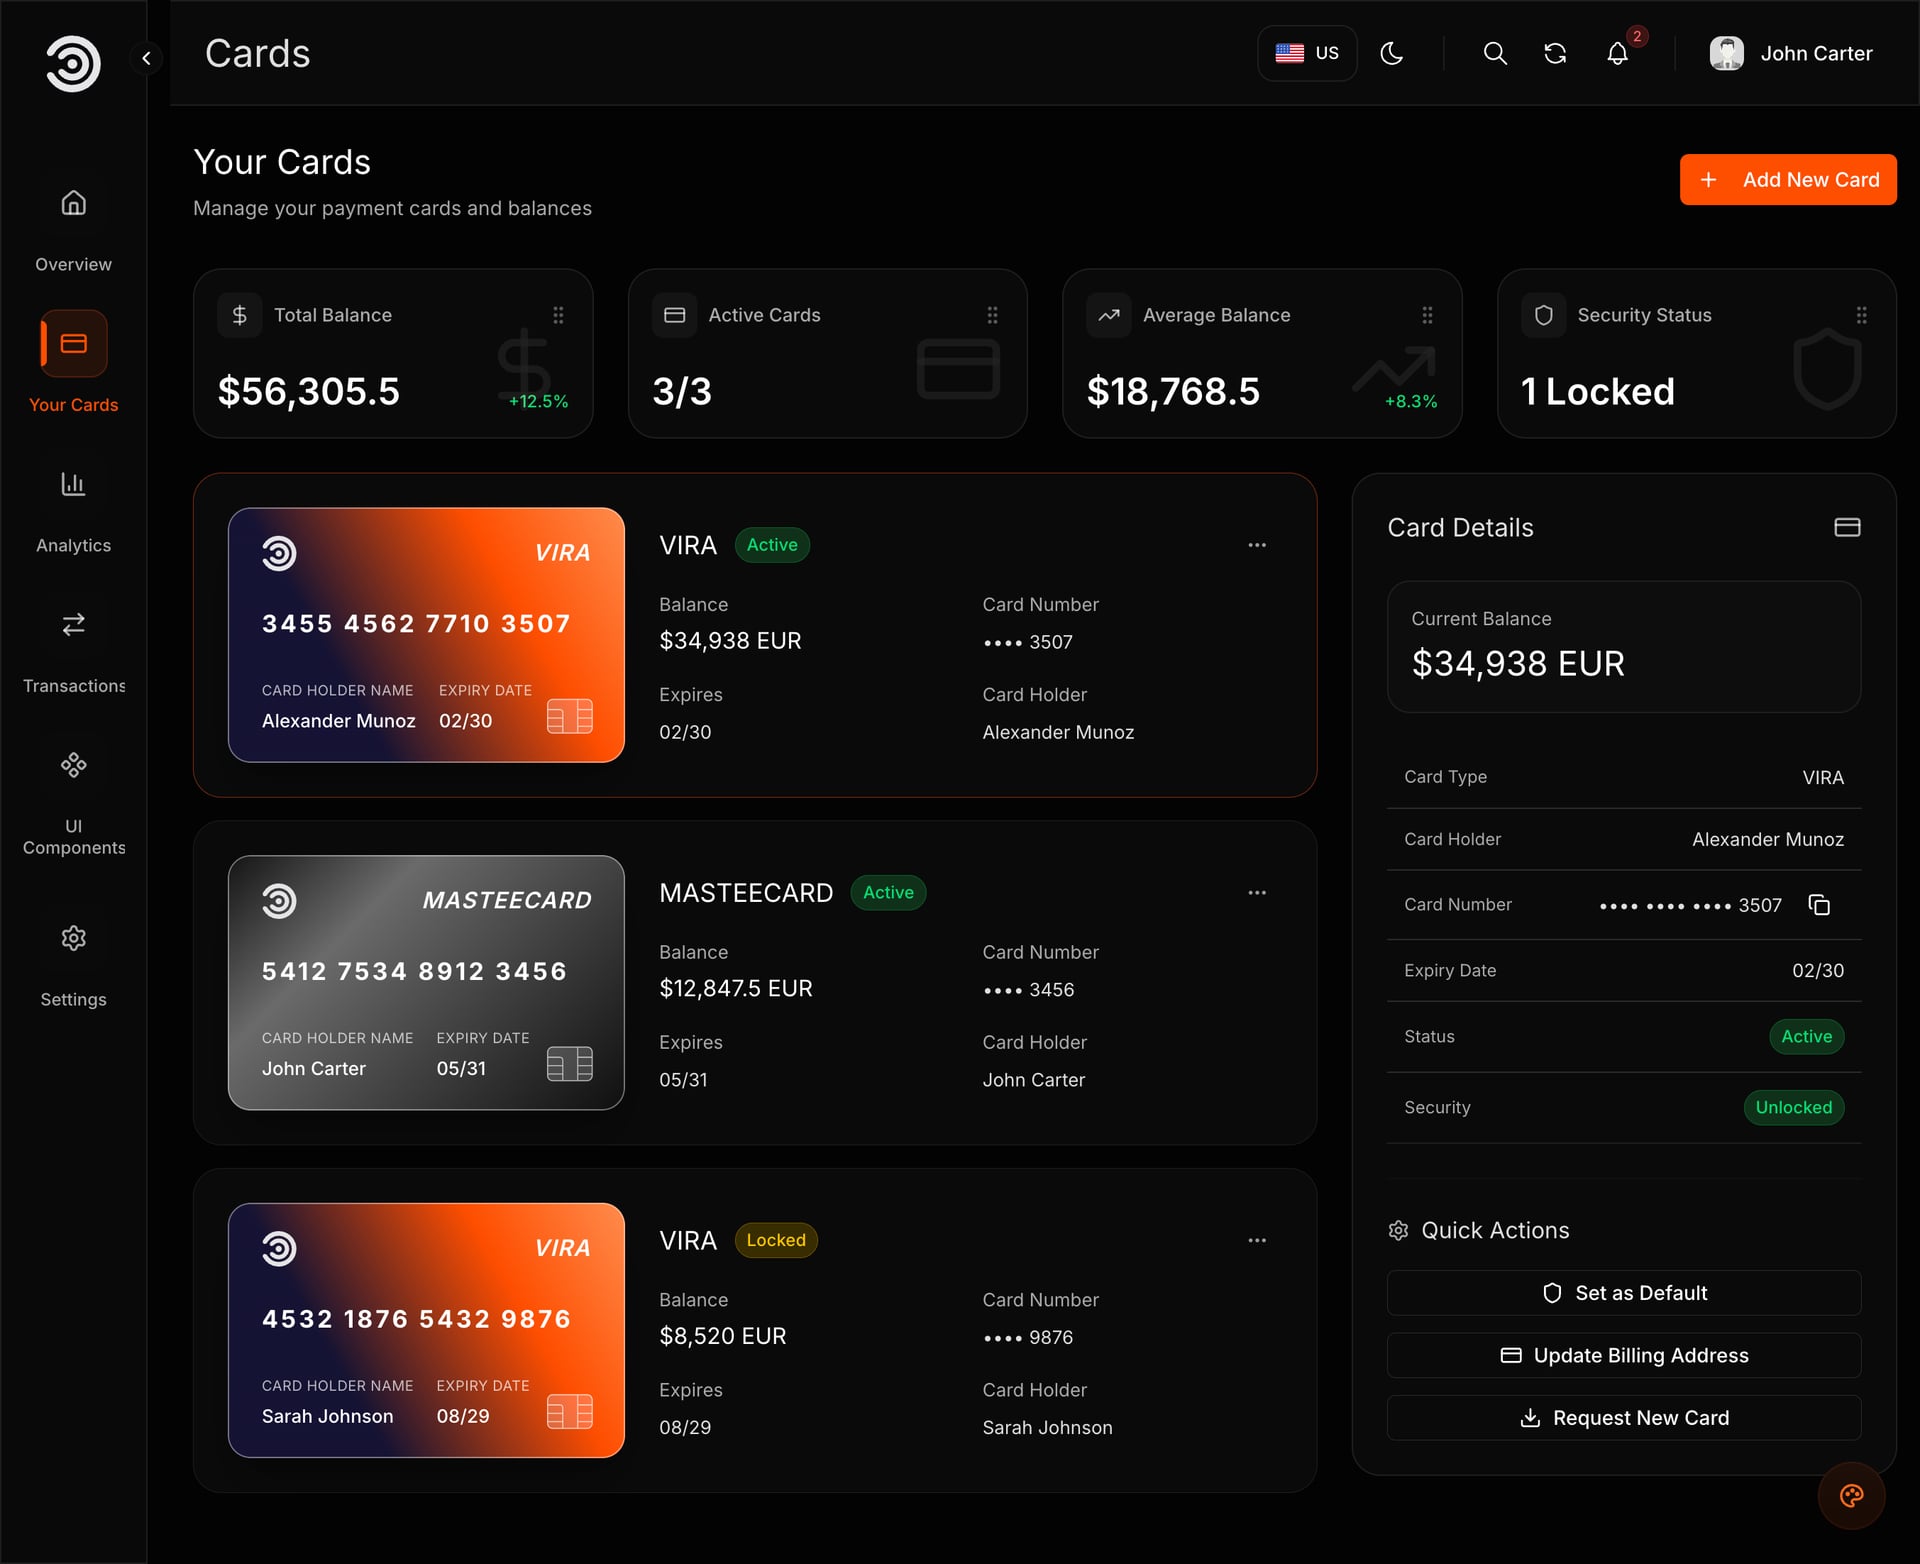
Look at the top row of figures and the details panel for the selected card.
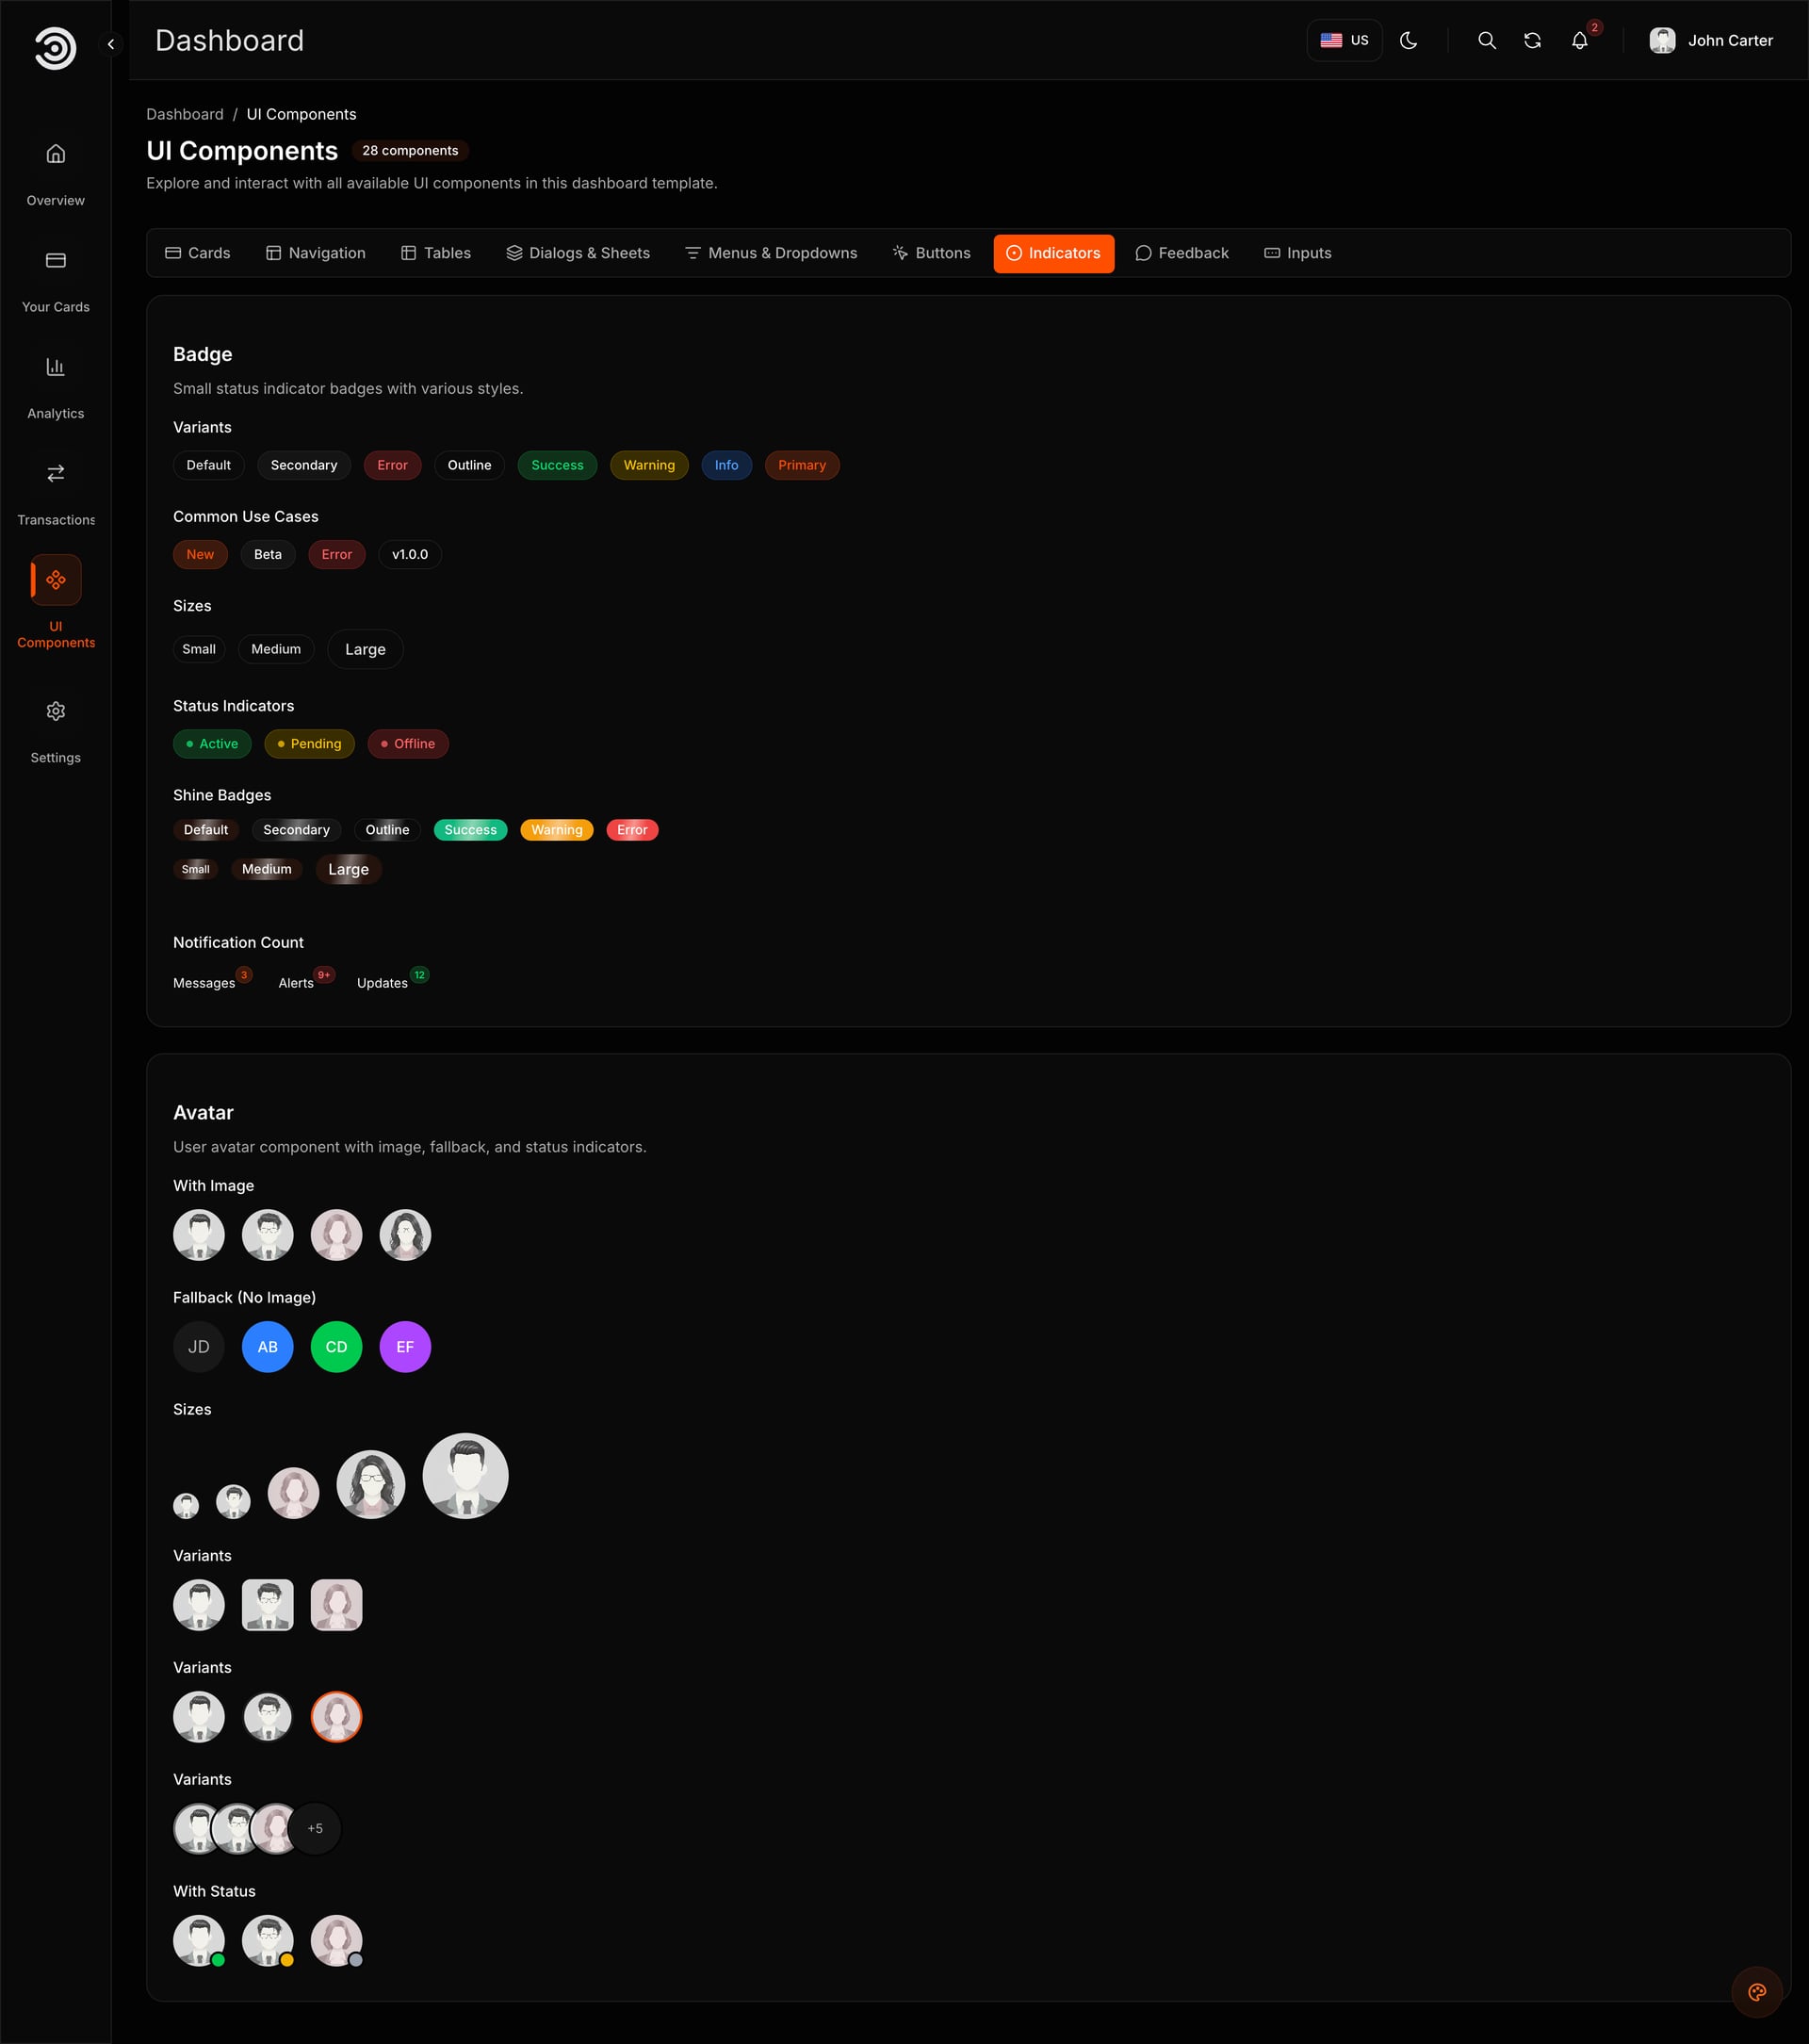
Look at the tabs on the components page: new screens you build later can reuse any of these parts. Add ?tab= and a tab id such as tables to open one tab directly.
4. Make it Kestrel's
Run yarn dev while you edit, and the page reloads on every save. These are the places to change:
- The name, tab title and description: the
Metadatablock inmessages/common/en.jsonandar.json. - The name on the sign-in and landing pages:
Login.titleandHero.titleinmessages/auth/. - The logo:
public/assets/images/icons/logo.svg. The sidebar and the corner of each payment card both use it. - The brand colour:
DEFAULT_THEME_COLORinsrc/Demo/ThemeColorSwitcher/themes.ts. Four themes ship: orange (the default), blue, golden and silver. - The favicon:
src/app/favicon.ico. The footer credit:src/app/[locale]/dashboard/layout.tsx.
The sample logo is pale grey, so the sidebar darkens it in light mode to keep it visible. If your logo is already dark, remove brightness-50 from the classes in src/layouts/Sidebar/components/SidebarLogo.tsx. Kestrel picks the blue theme and sets DEFAULT_THEME_COLOR to match; for a fully custom colour, change the values of one theme in that same file and leave its id in the constant.
The accent changes the card artwork, the charts' highlights, the buttons and the active menu item together. These three screenshots show the same overview in blue, gold and graphite.
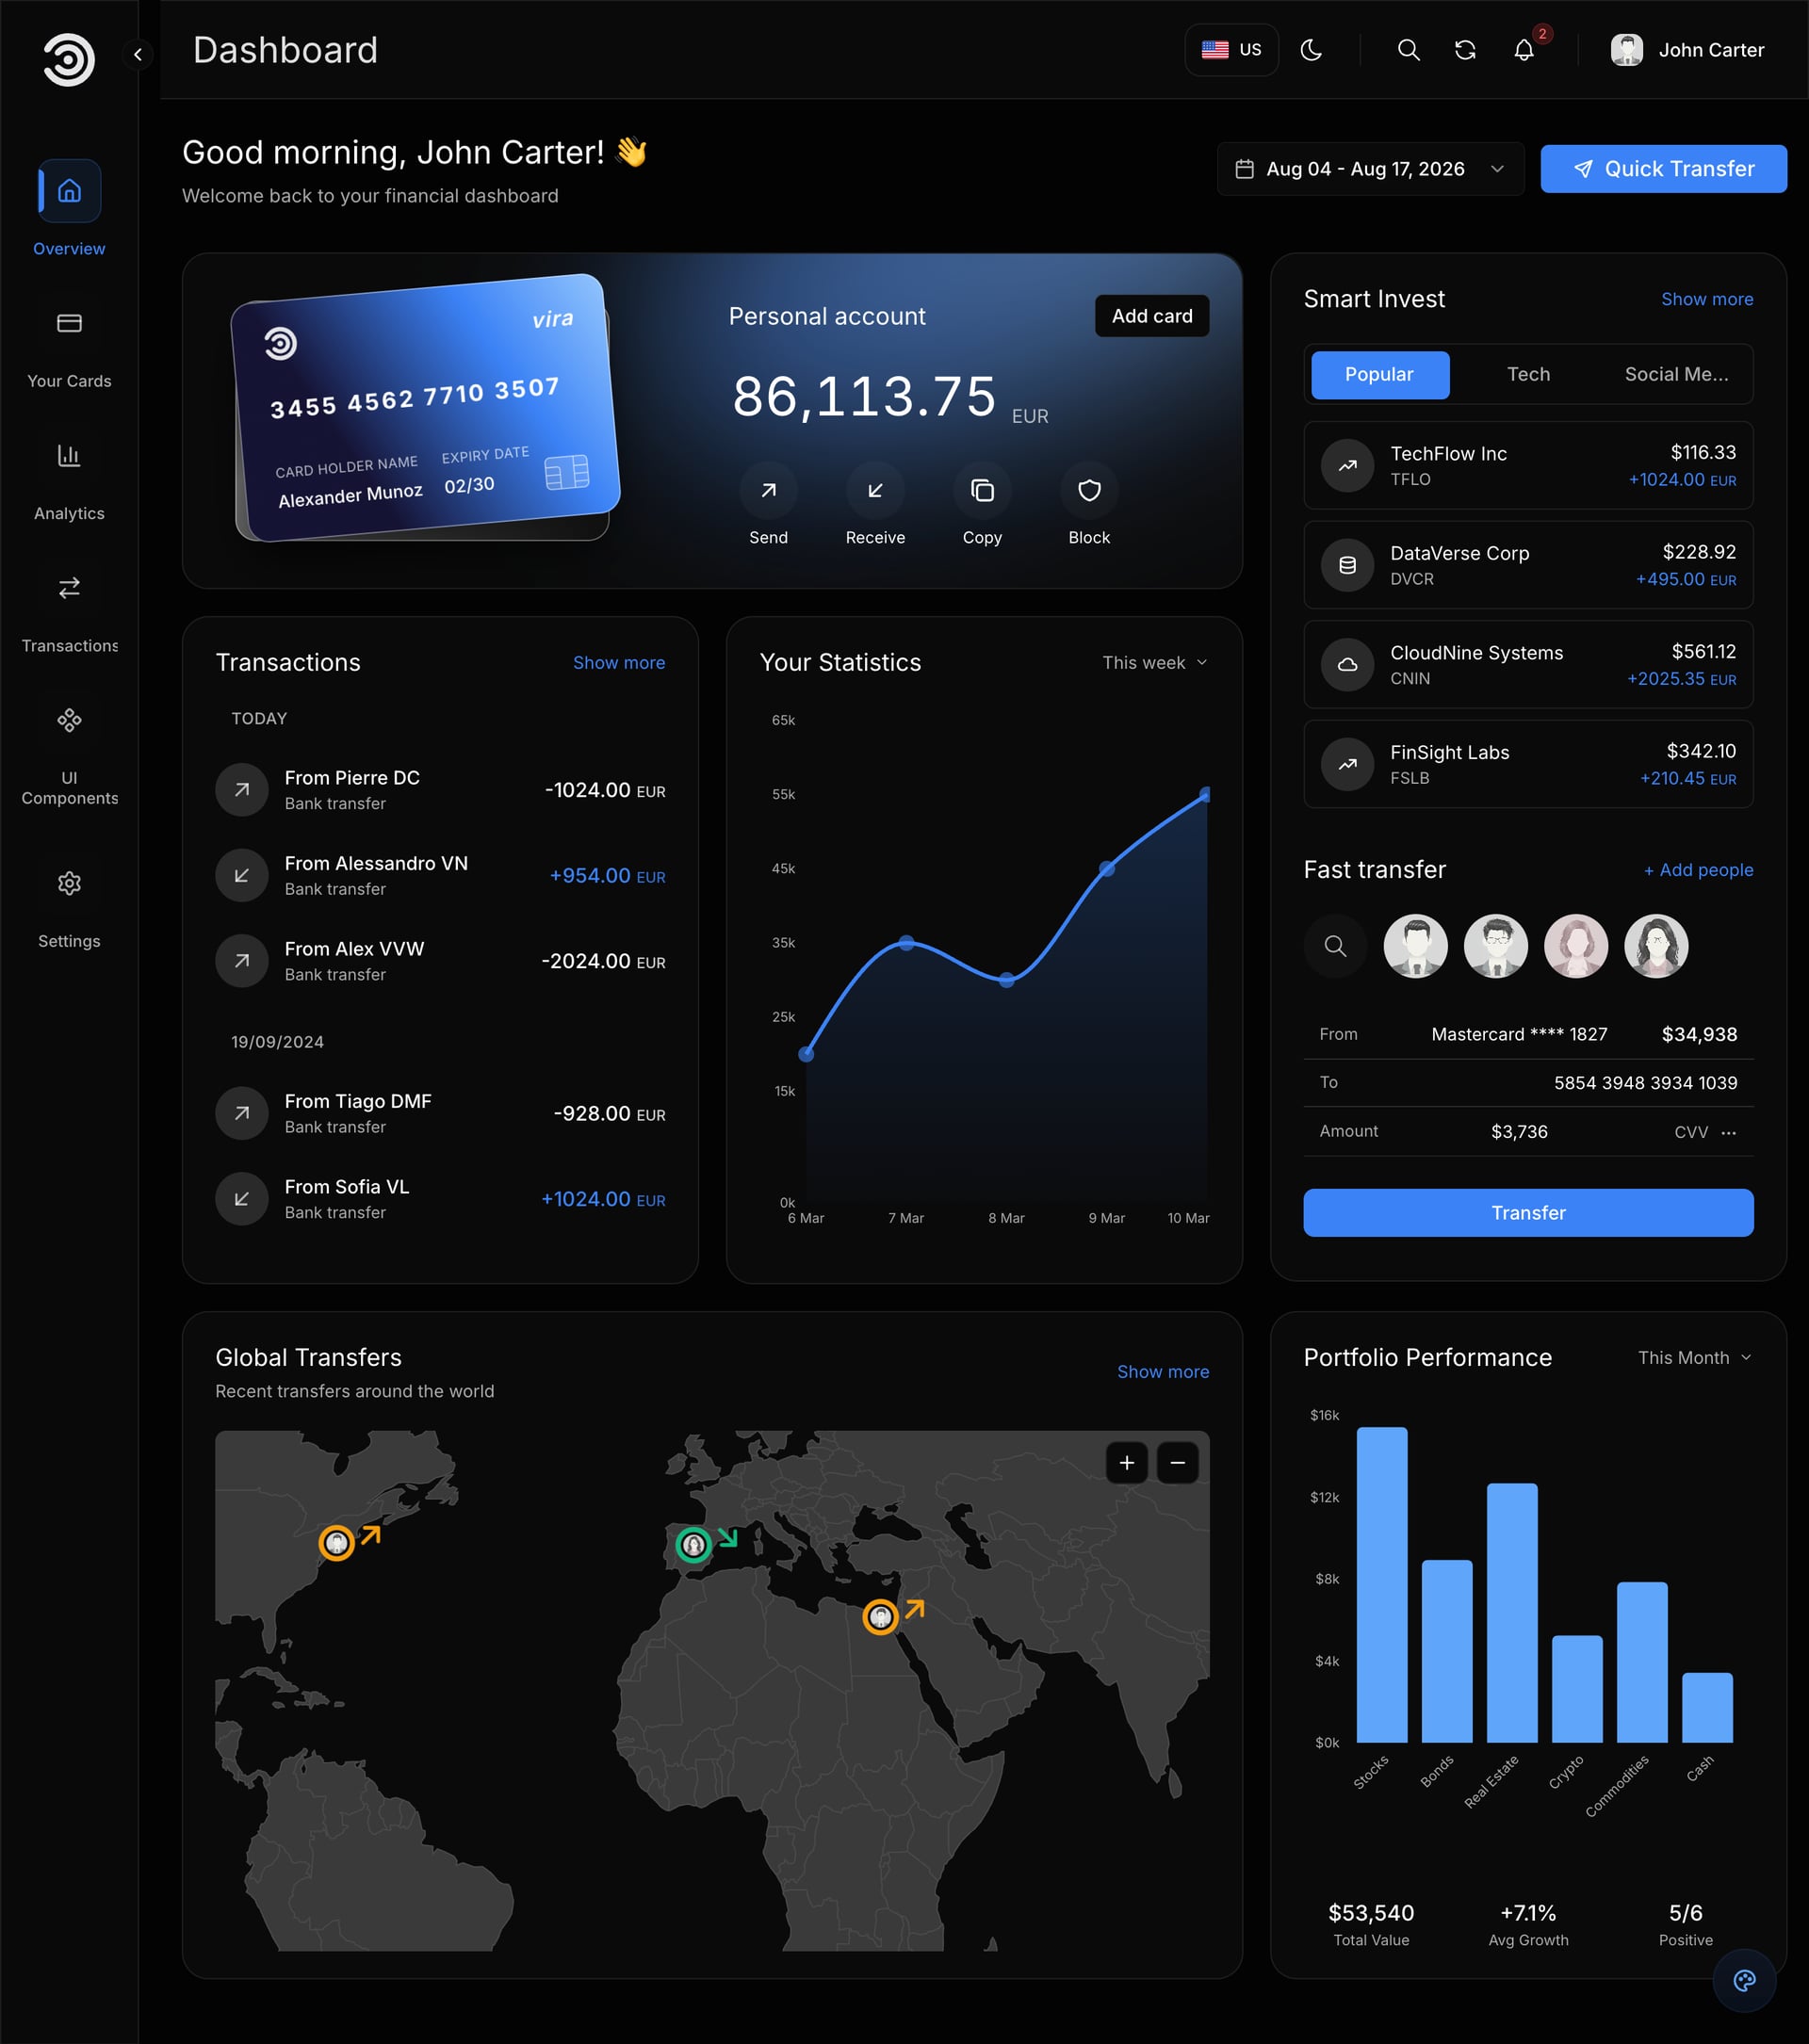
Look at the blue accent on the card, the chart highlights and the active sidebar item.
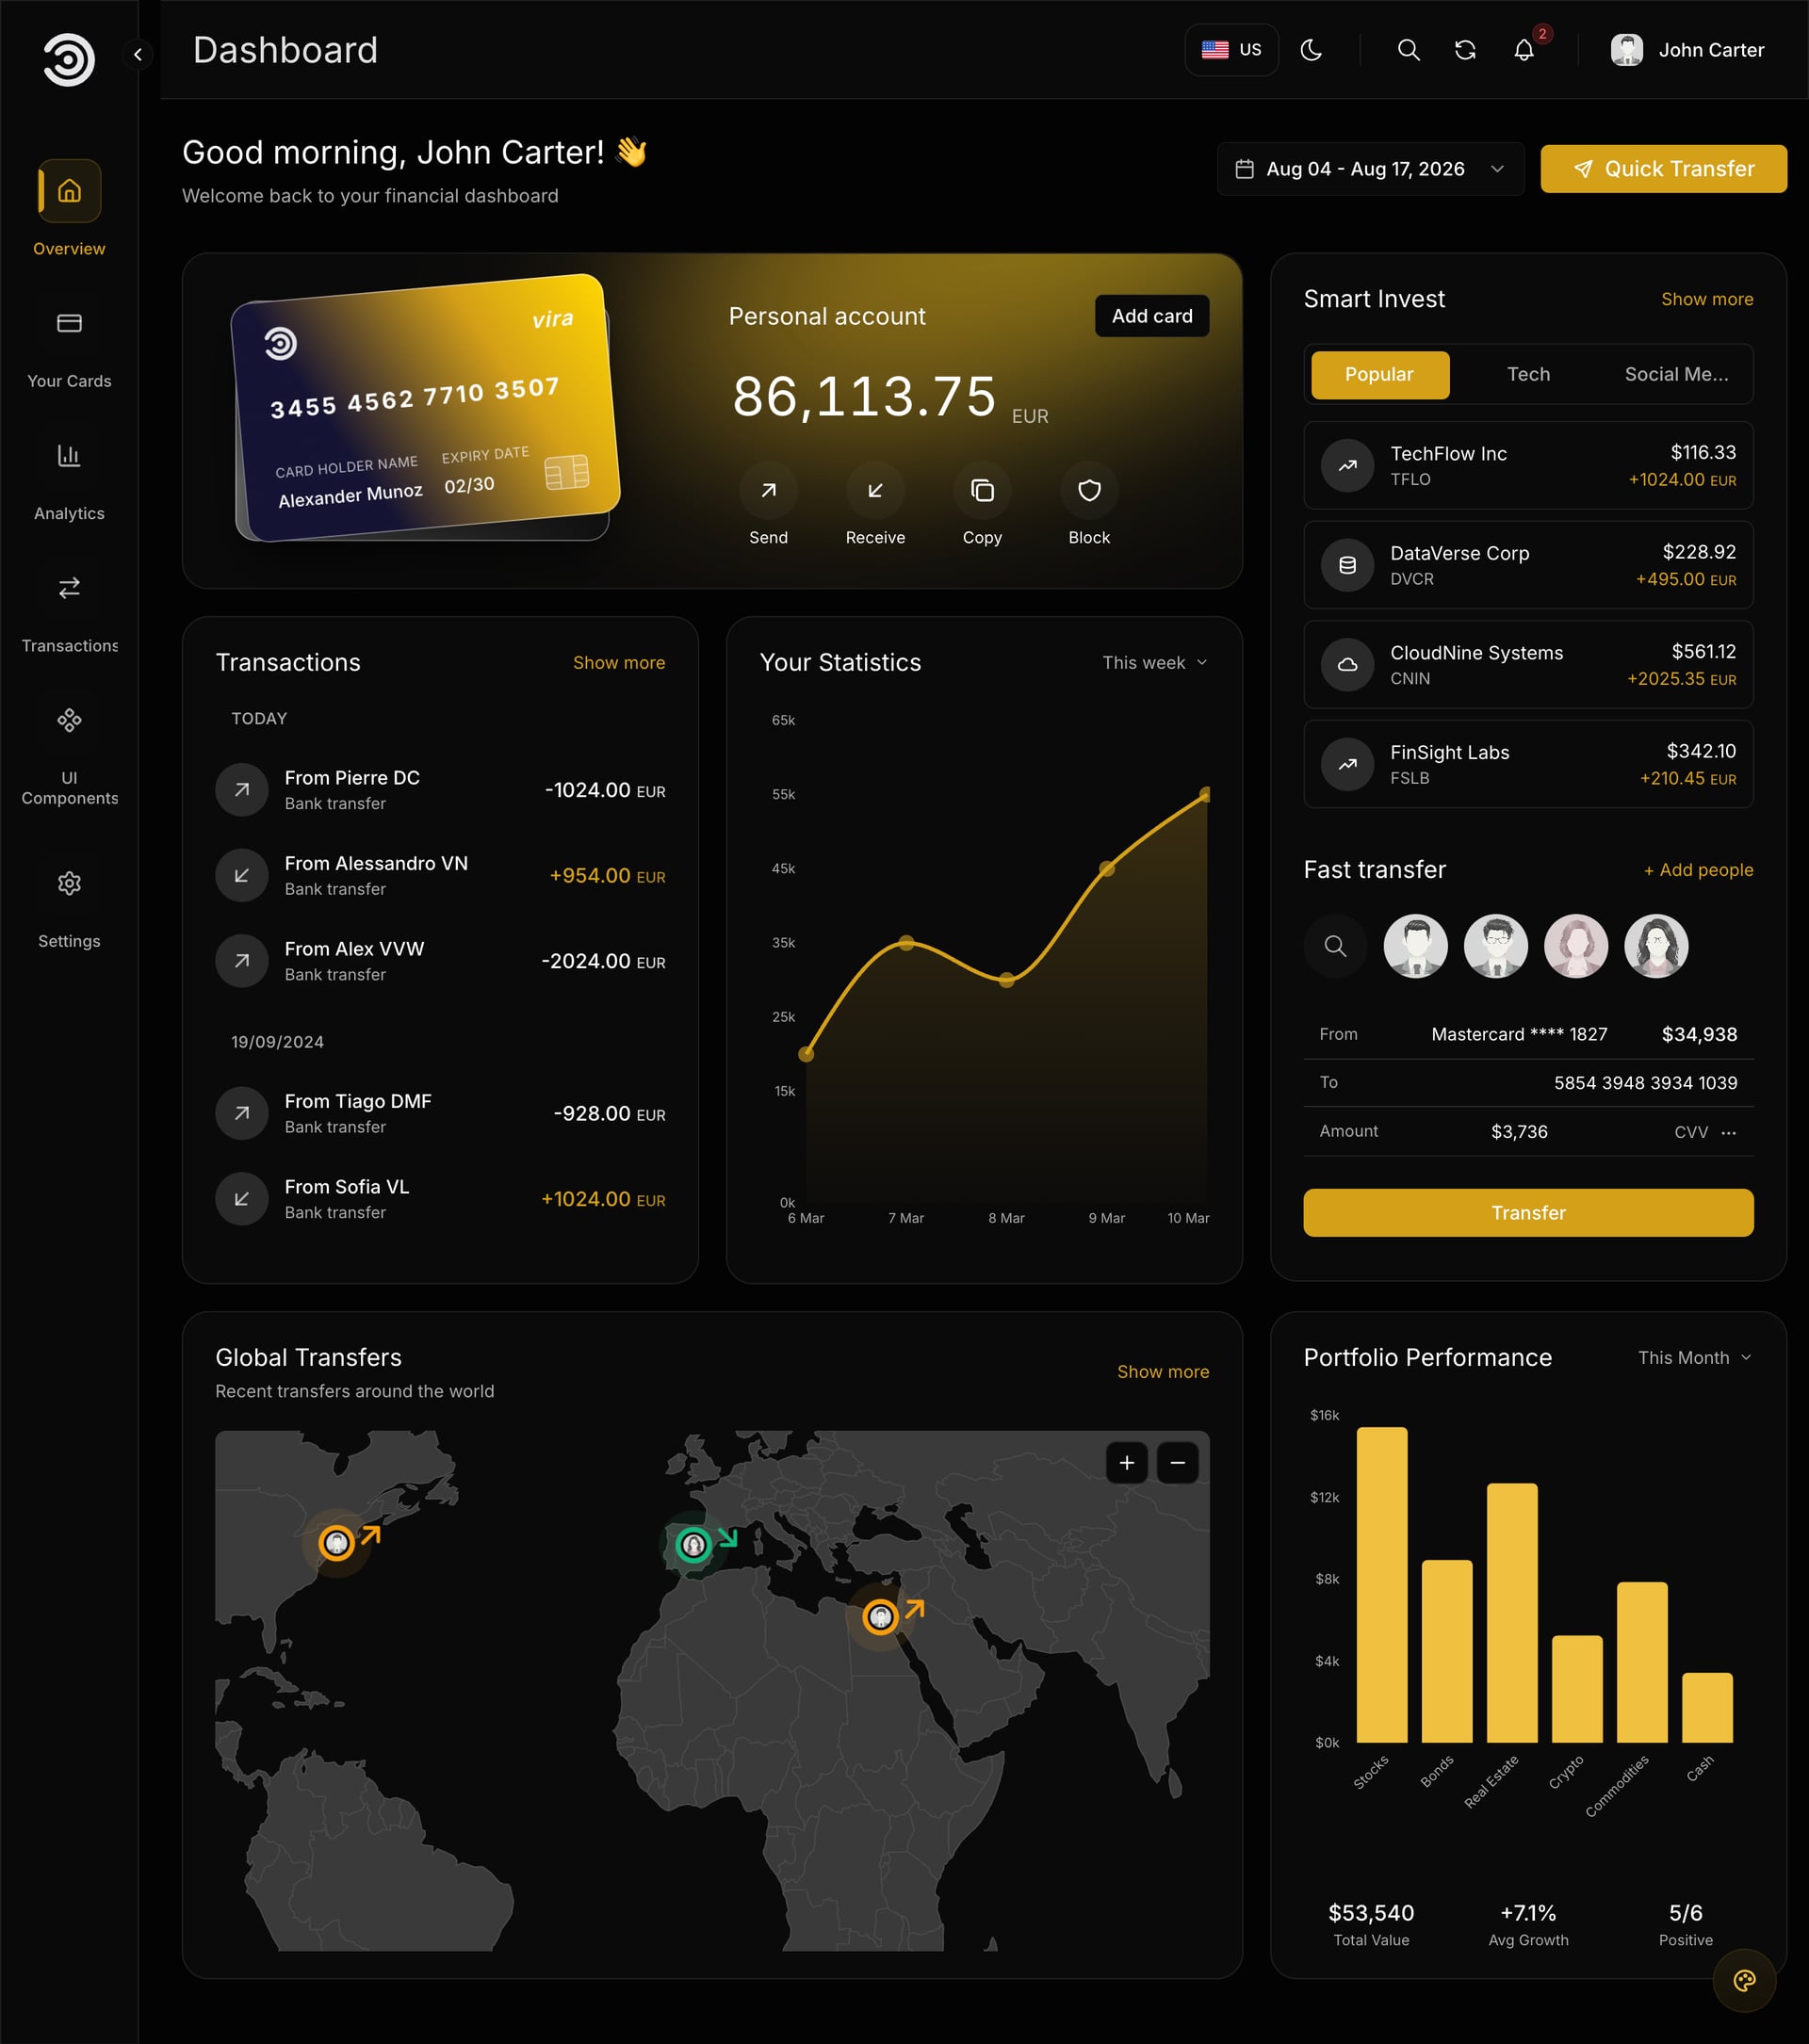
Look at how the same elements pick up gold, while the neutral backgrounds stay as they were.
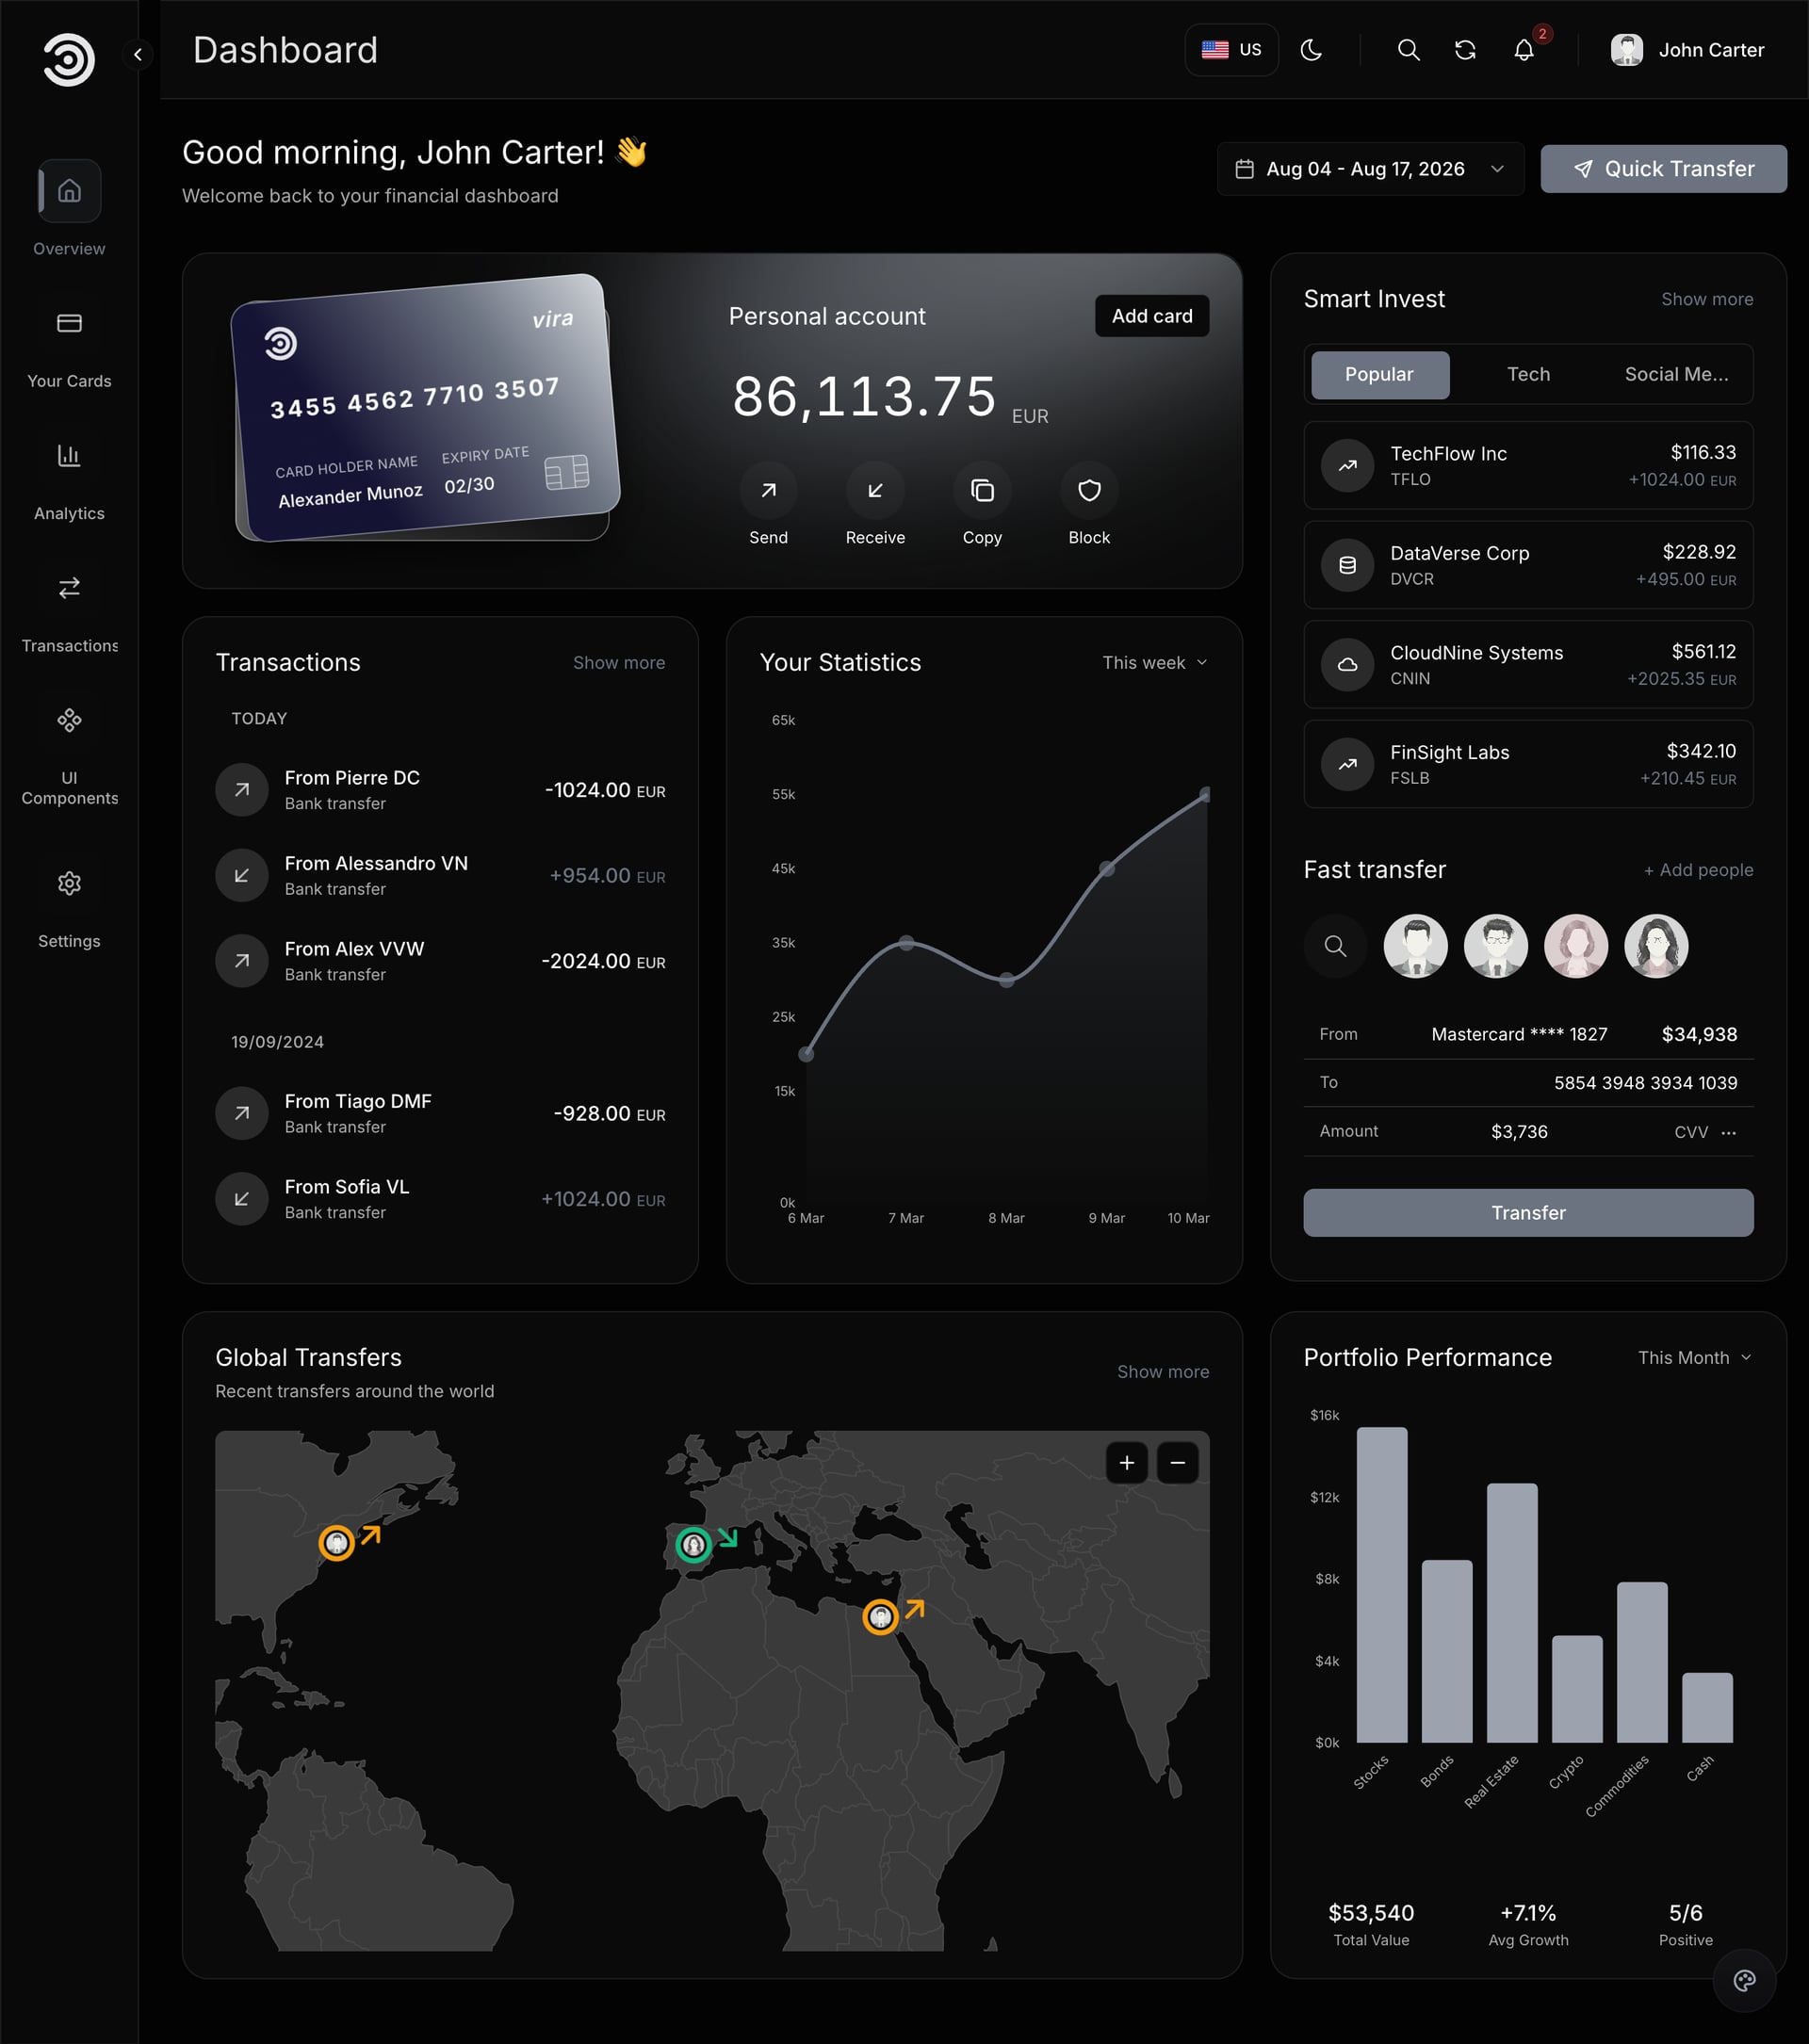
Look at the quieter graphite accent, which suits a more conservative brand.
Light and dark are both finished. The dashboard starts in dark mode, the sun and moon button switches it, and the browser remembers each person's choice. The same choice, plus language, sits under Settings, Preferences.
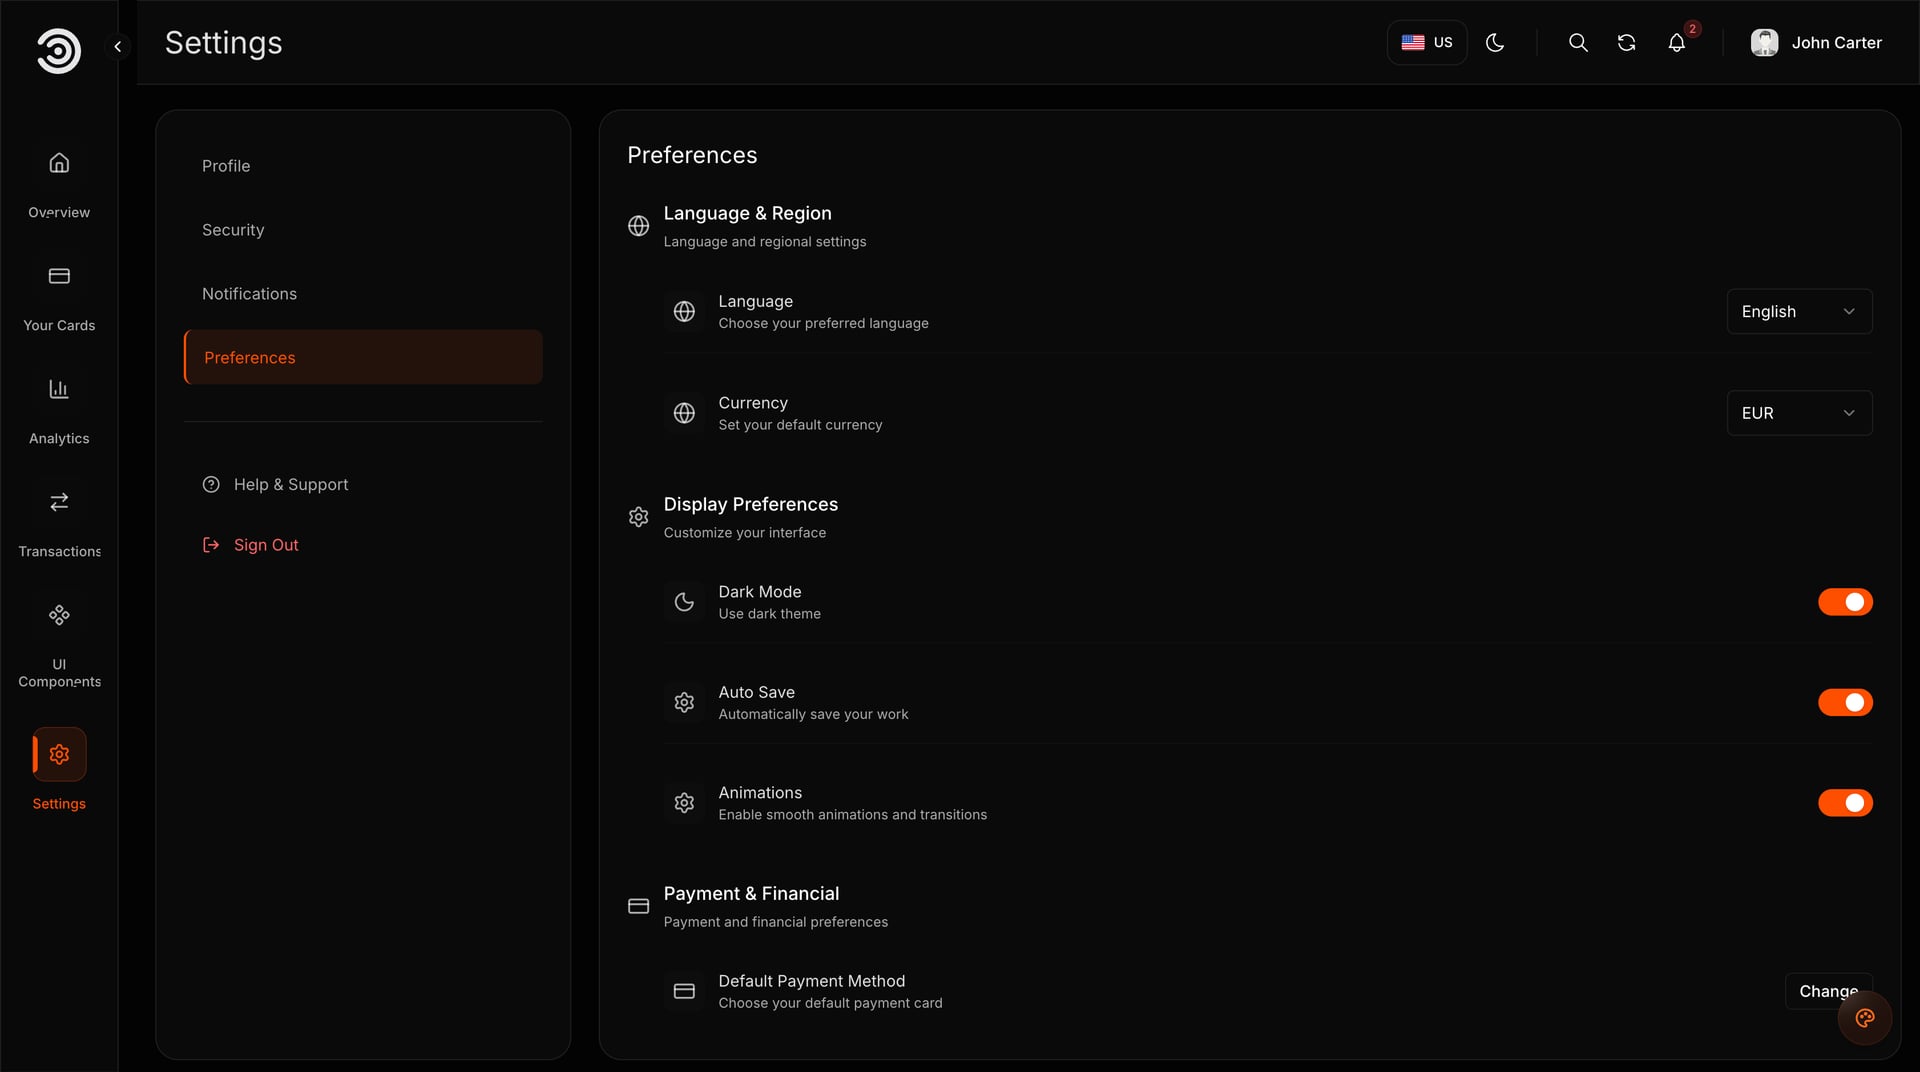
Look at the tabs across the top of settings: profile, security, notifications and preferences.
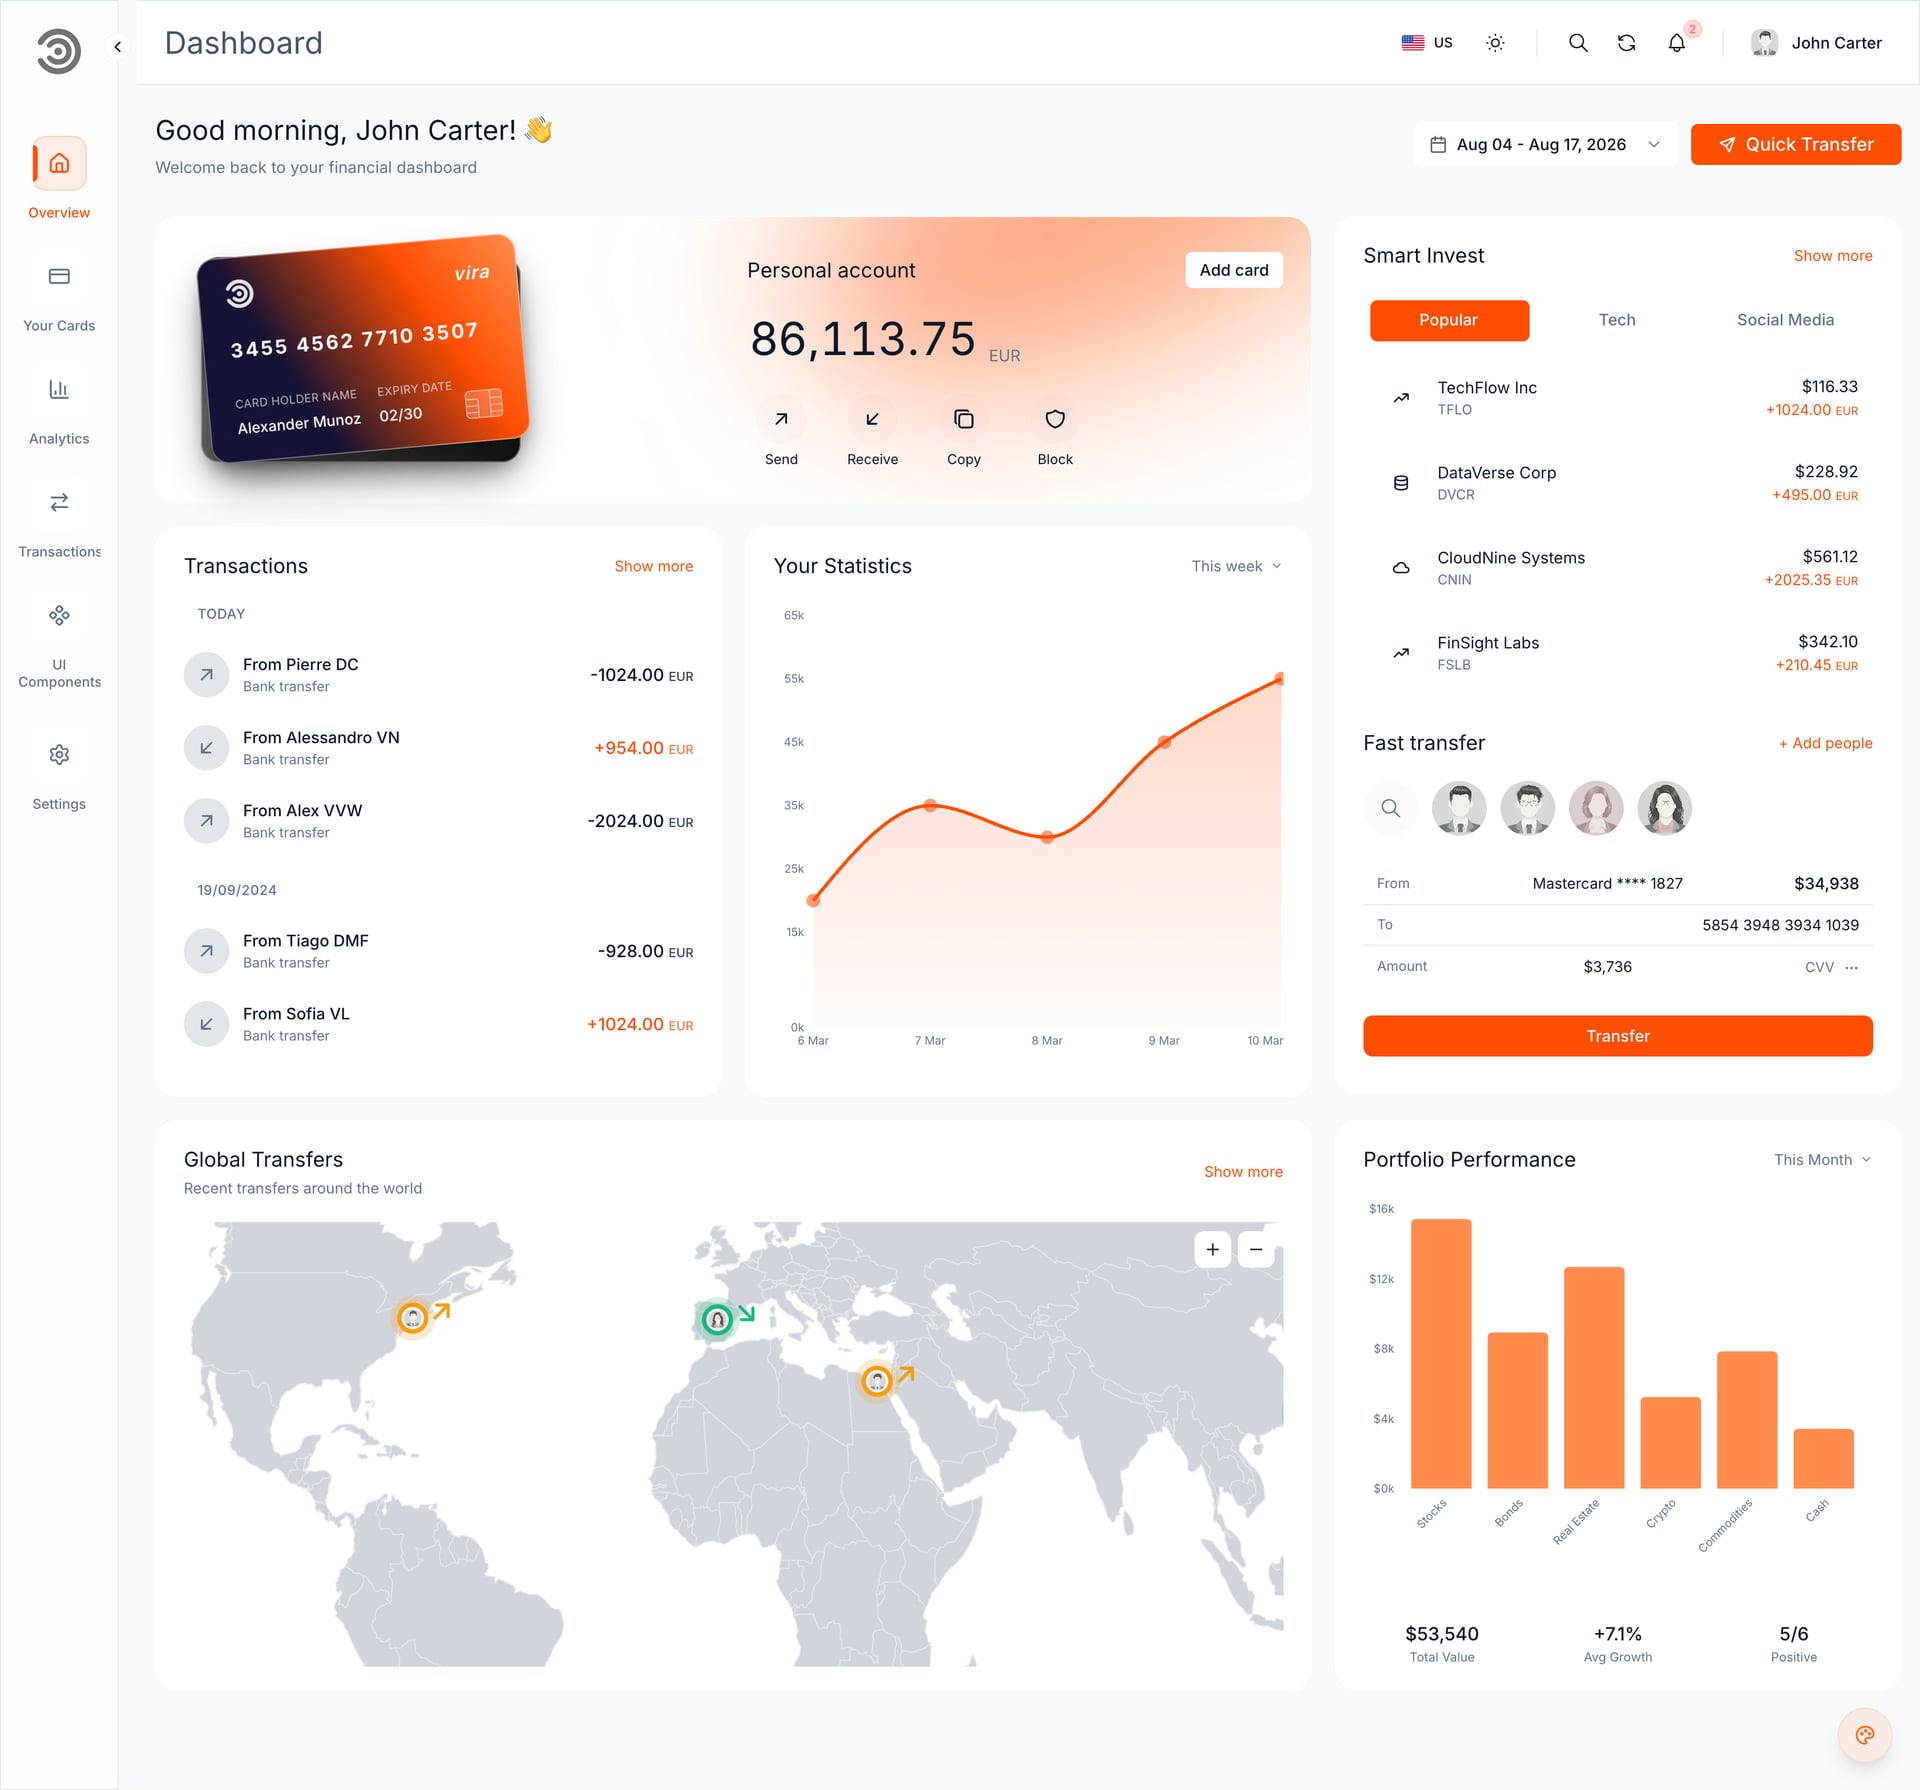
Look at the light version of the overview, which uses the same components as the dark one. Backgrounds, borders and text colors live in src/styles/theme.css, the light values in :root and the dark ones in .dark.
What to check: open the dashboard in both modes after changing the brand colour. What usually goes wrong: a new colour that does not show. With demo mode on, a floating colour switcher saves its pick in the browser and that pick wins over the code. Clear the site's data, or keep demo mode off.
5. Replace the sample data, one widget at a time
Each widget has its own sample data file, stored next to the screen that displays it. That is deliberate: you can swap the transactions table to your API this week and leave the world map for later. A workable order for Kestrel is the signed-in user, then transactions, then cards, then the analytics figures.
Know what already works without a server, so you do not rebuild it. Searching, sorting and paging the transactions, the date range and the Filter dialog all work in the browser. So do CSV and PNG exports, reordering the headline number cards by drag (the browser remembers the order), and locking or deleting a card until the next reload.
Know what saves nothing yet. Add Transaction, Add Card, the quick transfer, the fast transfer and Save Changes in settings check what the customer types and then stop. They are the exact places where your API calls go. The forms use React Hook Form with Zod, so the field checks are already written.
Two details save time. The sample transactions are dated relative to today, so the newest is always current, and the transactions page opens with a 30-day window. When you connect real data, check that your own dates fall inside the range the page opens on, or the table will look empty.
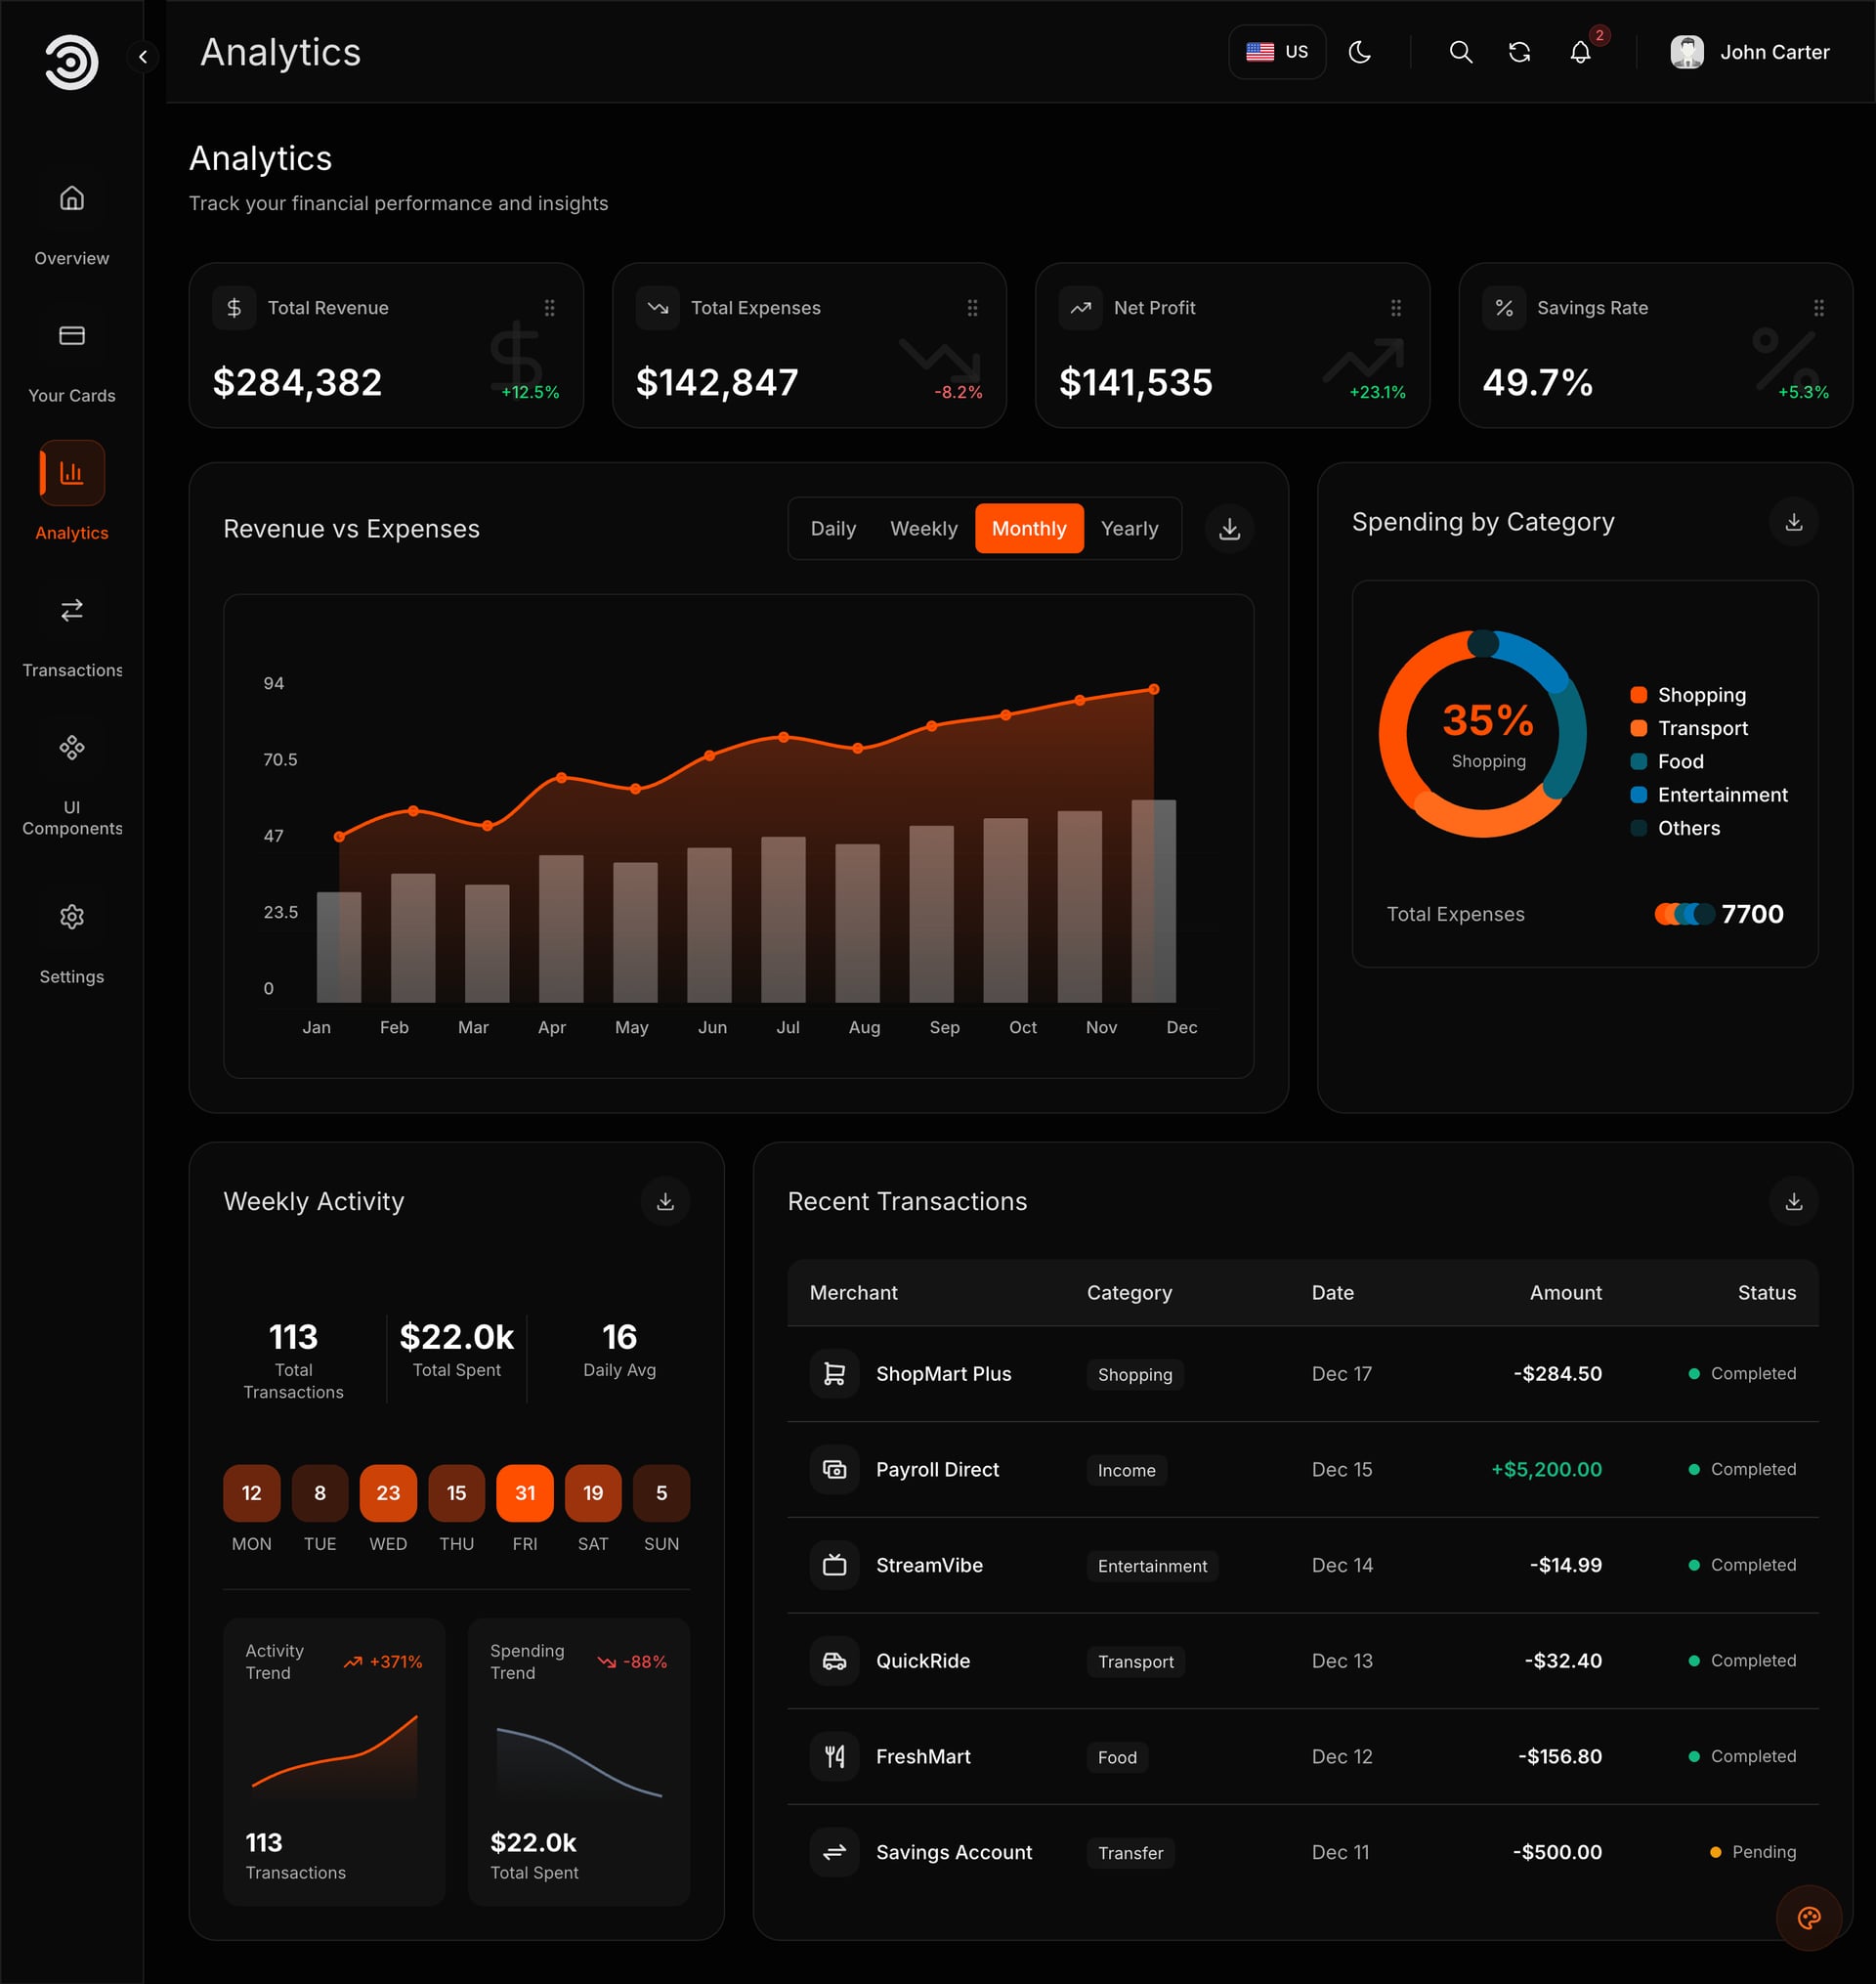
Look at the range buttons on the revenue chart (daily, weekly, monthly, yearly): your API will need to answer each range, or you can remove the ones you do not support.
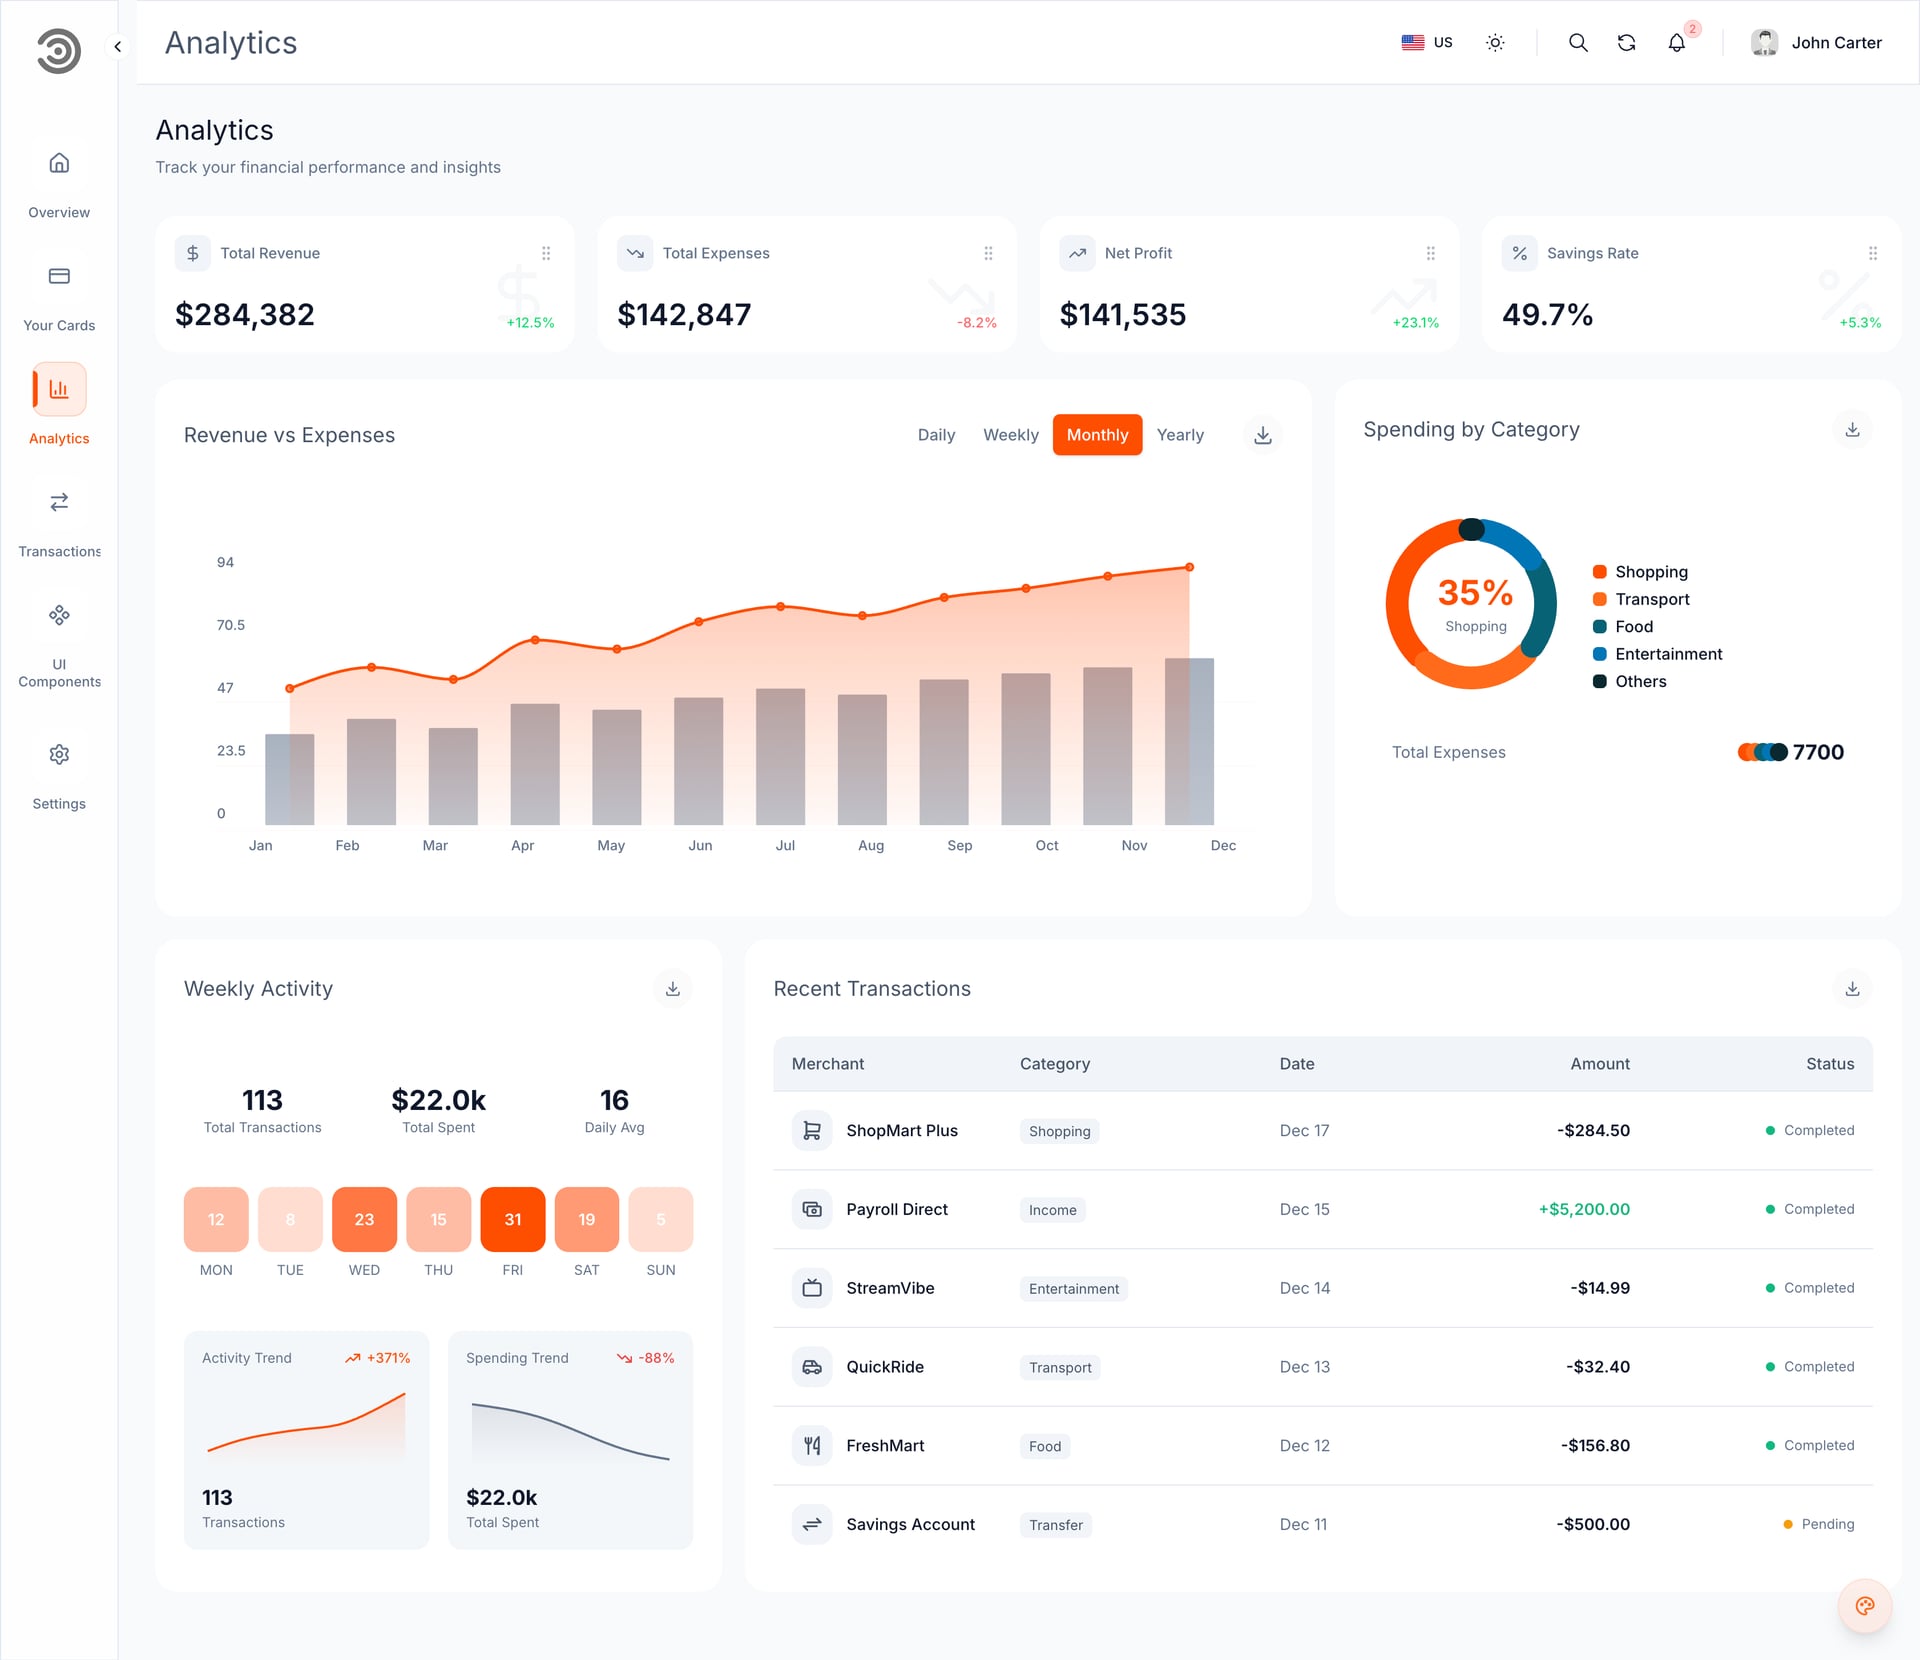
Look at the charts in light mode: they follow the brand colour and the theme, and their labels are translated.
For Kestrel the connection order looks like this, and you can copy the pattern for your own product:
- The user. One call that returns the signed-in person's name and picture, so the header menu stops showing the placeholder.
- Transactions. One read for the table, honoring the date range, plus the key figures above it.
- Cards. A read for the list and the selected card's details, then writes for lock and delete.
- Analytics. The revenue and expenses series for each range, the category split and the weekly activity.
- Settings. Saving the profile and preferences, so Save Changes finally does something.
A sensible way to plan the API is one read per widget, plus one write per action you keep. Start with the reads, since they unlock the screens, then add the writes in the order customers need them. The sample data is a ready-made description of the shape each screen expects.
What to check: after you swap one widget, reload in both languages and with an empty result, to see the empty state. What usually goes wrong: an API that returns amounts as text, which breaks sorting. Return numbers and format them in the page.
6. Replace the placeholder sign-in
The account you used in step 2 is checked inside the browser, and its details are in the code every visitor downloads. Every page under /dashboard sends anyone who is not signed in to /login, but that check also runs in the browser. For a finance product, that is a stand-in, not protection.
Before real customers or real money data reach the site, connect the sign-in to an API of yours, and verify the session on the server side. Redux Toolkit holds the signed-in user in the app, and the header menu shows the user your API returns (today it shows the placeholder account, John Carter, from src/config/demo-account.ts). The template's documentation includes the code to change and a worked example for this. Keep secrets on your server: a NEXT_PUBLIC_ value is readable by every visitor.
The Apple and Google buttons, Remember me and Forgot password do nothing yet, so decide whether your sign-in method needs them. Remove the ones it does not.
What to check: open a private window and visit a dashboard address directly. You should land on the sign-in page. What usually goes wrong: the browser-side redirect passes, so the page looks protected while the data behind it is not. Always protect the API.
7. Check the Arabic version
Open /ar. The layout sets lang="ar" and dir="rtl", so the sidebar jumps to the right edge and every card, table and menu is mirrored. Arabic text uses Noto Sans Arabic and English uses Inter. Opening / sends a visitor to /ar when their browser prefers Arabic, and to /en otherwise.
Texts are split by page under messages/, each folder with an en.json and an ar.json. When you add markup, use logical classes like ms-2, pe-4 and text-start; physical ones such as ml-2 break the right-to-left page. Test the CSV export in Arabic too. Excel opens the file with Arabic text intact, and amounts start with + or -.
What to check: every page you changed, in /ar, with real-length names and long numbers. What usually goes wrong: text added to en.json only, which leaves a missing key in Arabic.
8. Run the pre-launch checks
Build the production version and look at it the way a customer will:
yarn build
yarn start
Open it on a phone as well as a laptop, and in both languages and both themes. Turn demo mode off: when NEXT_PUBLIC_DEMO_MODE is true, the sign-in page shows the demo details, fills them in and adds a floating colour switcher. It is off by default. Also remember that the world map on the overview fetches its country outlines from cdn.jsdelivr.net, so it stays empty behind a firewall that blocks that address.
The development and production commands differ in one useful way: yarn start serves the last build, so run yarn build again after every change. When errors appear that your code does not explain, delete the .next folder and build again.
Use this pass as a short rehearsal of launch day. Walk the whole customer journey once, slowly:
- Open the landing page and enter the dashboard the way a new customer would.
- Search the transactions, narrow them with the date range, and export the file. Open it in a spreadsheet.
- Lock and unlock a card, then reload to see what persists. Anything that reverts is a place for your API.
- Switch to Arabic and repeat the same path.
- Resize the window down to a phone width and look for clipped numbers or buttons.
Write down every surprise. Each one becomes either a fix, a hidden button or a line in your support notes.
9. Put it online
Nothing needs configuring: no database, no secret, no mandatory variable. Deployment is short. You have three routes:
- Vercel. Push the folder to a private Git repository (the licence does not allow public source), import it, keep the default Next.js settings, and add
ENABLE_EXPERIMENTAL_COREPACKwith the value1so Vercel uses the pinned Yarn version. Then add your domain. - A Node.js server. Use Node.js 20.9 or newer, then install, build and start. It listens on 3030, so place Nginx or Caddy before it to serve your domain over HTTPS, and keep
yarn startalive with a process manager. On a host that sets the port, useyarn start -p $PORT. - Docker. The included
Dockerfilebuilds a small image that runs as a user without admin rights.
After any change to a NEXT_PUBLIC_ value, build again. Those values are compiled in when the app is built.
What to check: load the live address, switch language, switch theme, and sign in with your real method. What usually goes wrong: a host that sets its own port while yarn start keeps listening on 3030.
Running it day to day
After launch, most of the work is small and repeatable.
- Connecting another widget. Pick one widget, replace its sample file with a call to your API, test in both languages, and ship it on its own.
- Changing a text. Edit the value in the right
en.jsonand the matchingar.json, keeping the keys as they are and leaving anything inside curly braces untouched. Restartyarn devor rebuild. - Adding a language. Add the code to
src/i18n/routing.ts, copyen.jsonin each of the eight folders undermessages/, translate the values, and add the language to the menu insrc/components/LanguageSelector.tsx. Only Arabic is treated as right to left, so another right-to-left language needs a few extra edits. - Changing the accent. Edit one line,
DEFAULT_THEME_COLOR, and rebuild. - Handling support questions. A customer who "loses" their preferences usually cleared browser data, because the browser remembers the key figure order and the theme choice, per browser.
- Updating dependencies. Dependencies carry exact versions, with a lockfile in the download. Change a version on purpose, test the build, and use Yarn so the lockfile stays in charge.
What it costs to run
The template is a one-time purchase from $99, with lifetime support listed on the product page. Running the front end itself costs hosting and nothing else.
The bigger line is what you build behind it. You pay for the API, the database, the sign-in service and anything that moves or reads money, each at its provider's own rates. Check what your payment or banking partner and your regulator require before you show real balances. The template does not include any of that.
Free parts: there is no database to license, no required service, and the sample data runs offline (apart from the map shapes and the fonts downloaded at build time).
What to customise next
- The accent. Try the four themes (orange, blue, golden, silver) and pick one that fits the brand. Charts, buttons and the card artwork follow it.
- Currency and categories. Change the sample categories to the ones freelancers actually use, such as tax set-aside, software and travel.
- The landing page. The page at
/enhas the product name, three tiles and an Enter Dashboard button. Rewrite it as your entry point. - More screens. The UI Components page lists the parts (tables, dialogs, sheets, tabs, date pickers), so a new page such as Invoices can be assembled from them in the same style.
- A third language. Add the code to
src/i18n/routing.ts, copy eachen.jsonin the eight message folders, and add it to the language menu.
Launch checklist
- The placeholder account removed and a real sign-in connected, with the session checked on the server.
- Every widget you keep reads from your API, and every button you keep saves somewhere.
- Buttons you will not build are hidden or removed.
NEXT_PUBLIC_DEMO_MODEis off.- Name, logo, favicon, colour and footer credit changed.
- All new text exists in both
en.jsonandar.json. - Every changed page checked in
/ar, in light and dark mode, on a phone. - Production build run with
yarn buildand tested before deploy. - Domain, HTTPS and hosting settings in place.
- Your partner's and regulator's requirements for money data confirmed.
Common mistakes
Shipping the placeholder sign-in
The template's account is public by design. Anyone who opens the page source can find it. Replace it before launch.
Expecting buttons to save data
Add Card, Add Transaction and Save Changes do nothing on the server because there is no server. Wire each one you keep, and hide the ones you will not build.
Leaving demo mode on
Demo mode prints demo sign-in details on the login page. Keep NEXT_PUBLIC_DEMO_MODE off for a real product.
Forgetting to rebuild after a setting change
With yarn start or Docker, a changed NEXT_PUBLIC_ value does nothing until the app is built again.
Copying the sample card behavior onto real card data
The Your Cards page has a show-number control, and it works on invented sample numbers. Before real card details travel to the browser, ask your card or payment provider what it allows, and design what the screen shows (often only the last digits) around that answer.
Hiding the problem instead of the button
A button that does nothing teaches customers not to trust the page. If an action is not built yet, remove it from the screen until it is, rather than leaving it to fail quietly.
Testing only in English
Numbers, dates and long labels behave differently in right-to-left layouts. Open every page you changed in /ar before you call it done.
FAQ
How do I build a fintech dashboard with Next.js?
Start with a finished interface, then connect your data. This template provides the pages, charts and forms, and you connect an API for balances, cards and transactions plus a real sign-in.
Do I need a backend?
Yes, for anything real. The template has no back end or database, so a live product needs your own API. The sample data lets you design and demo without one.
Can it connect to a bank or show real accounts?
Not by itself. It shows whatever your API returns. Any bank connection, card service or payment provider is something you add on the server side.
Does it support Arabic and RTL?
Yes. Every label, chart legend, table heading and form message exists in English and Arabic, and Arabic pages render right to left.
Which charts does it use?
Recharts draws the area, bar, donut and heatmap-style charts, and each can be downloaded as a PNG. The transactions table is built with TanStack Table.
Can I use it for clients?
Yes. The commercial licence covers unlimited projects, including work delivered to a client. You may not share the source code publicly or resell it as a template.
Is the sign-in secure out of the box?
No. It is a placeholder checked in the browser, meant to be replaced with a sign-in connected to your own API before real customers use it.
Does it have dark and light mode?
Yes. Both are finished, the dashboard starts dark, and the browser remembers each person's choice. The brand accent is a separate setting.
Can I export data from the dashboard?
Yes. The transactions page exports a CSV file for the chosen date range and filters, and the charts can be saved as PNG images. Both work in the browser with the sample data.
Try it yourself
Open the live demo to see every page. The Financial Dashboard product page has the details, and the documentation covers each step above. For other dashboards, browse the admin dashboard templates category, or read how Arabic and RTL dashboards are handled.
This template is also one of the ten in the Next.js Templates Bundle, if you expect to build more than one kind of product.
You might also like
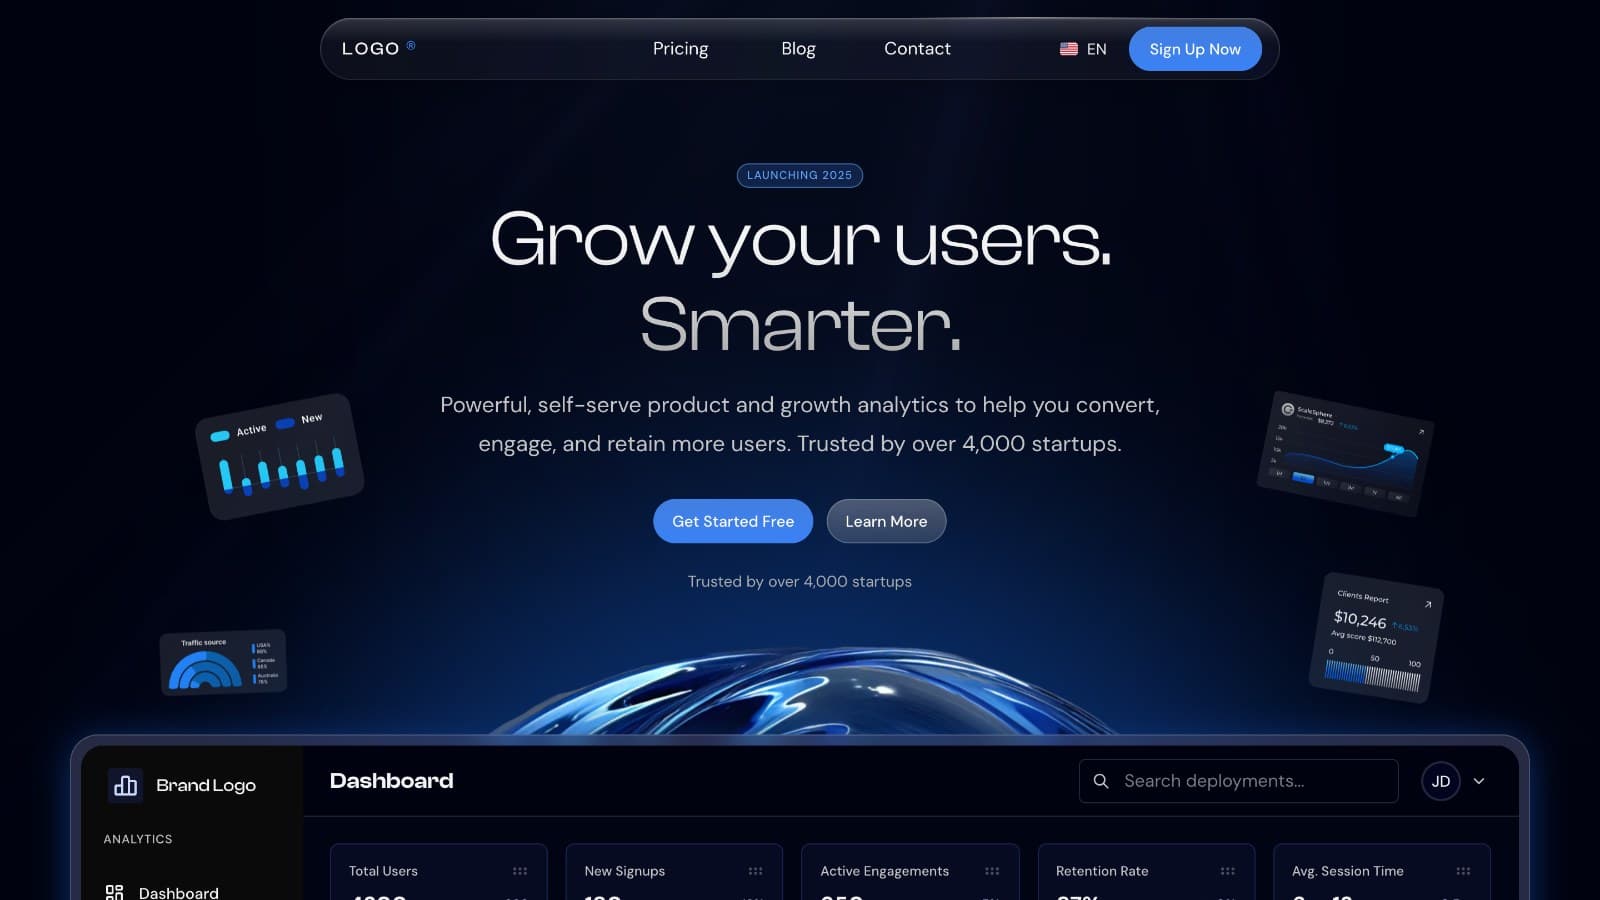
How to Launch a SaaS Website in English and Arabic With Next.js
Launch a SaaS marketing website in English and Arabic with Next.js: pricing, blog, forms, SEO settings and going live, plus what you connect yourself.
How to Build a Real Estate Agency Website in Next.js
Build a real estate agency website in Next.js with property listings, viewing requests and an admin dashboard: setup, staging, roles and launch.
How to Build an Online Fitness Coaching App with Next.js
Build an online coaching platform with client rosters, assigned workouts and weekly check-ins using Next.js and NestJS. A worked example, step by step.
